Download
1 / 6
60 likes | 223 Views
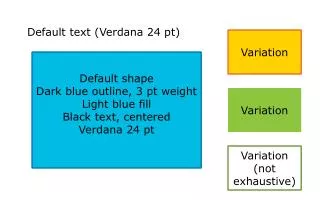
Default text (Verdana 24 pt ). Variation. Default shape Dark blue outline, 3 pt weight Light blue fill Black text, centered Verdana 24 pt. Variation. Variation (not exhaustive). In this lesson, you are going to learn how to compare distance-time graphs and equations.

E N D
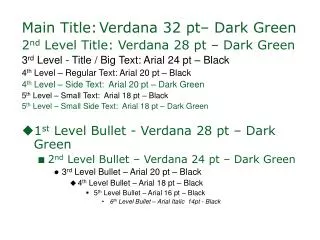
Default text (Verdana 24 pt) Variation Default shape Dark blue outline, 3 pt weight Light blue fill Black text, centered Verdana 24 pt Variation Variation (not exhaustive)
In this lesson, you are going to learn how to compare distance-time graphs and equations.
y = 8x + 30 Maria installs carpet for $8 an hour plus a $30 installation fee.
Distance-Time Representations distance = rate x time d = r x t / d = rt d = 10t Example: Biking at 10 miles an hour distance = rate x time d = r x t / d = rt
Distance-Time Representations distance = rate x time d = r x t / d = rt d = 10t d = 10t
Three cars are traveling from New York City to Washington, DC. Each are represented below. Which car is driving at the fastest rate? Miles = 65 x hours