Download
1 / 20
250 likes | 484 Views
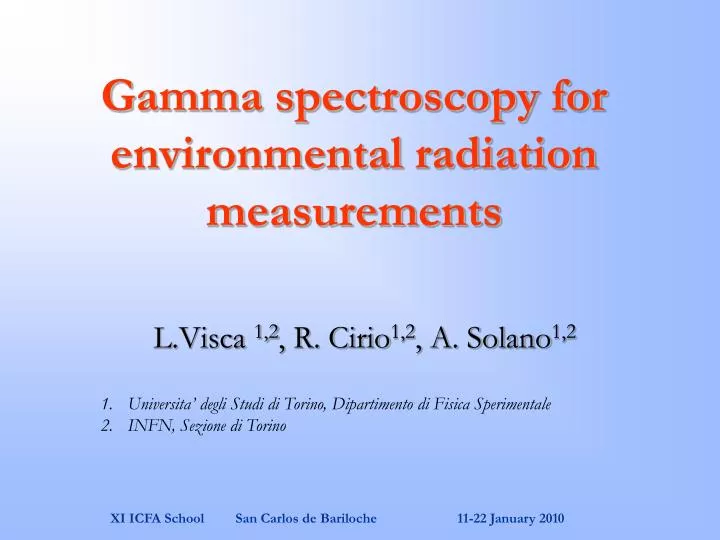
Gamma spectroscopy for environmental radiation measurements. L.Visca 1,2 , R. Cirio 1,2 , A. Solano 1,2. Universita’ degli Studi di Torino, Dipartimento di Fisica Sperimentale INFN, Sezione di Torino. Summary. Overview about natural background radiation

E N D
Gamma spectroscopy for environmental radiation measurements L.Visca 1,2, R. Cirio1,2, A. Solano1,2 • Universita’ degli Studi di Torino, Dipartimento di Fisica Sperimentale • INFN, Sezione di Torino XI ICFA School San Carlos de Bariloche 11-22 January 2010
Summary • Overview about natural background radiation • Description of a portable scintillation detector system NaI(Tl) • Calibration of a scintillation detection system • Analysis of gamma spectra from different samples • Activity assessment from measured spectra XI ICFA School San Carlos de Bariloche 11-22 January 2010
Natural radiation exposures All living organisms are continually exposed to ionizing radiation, which has always existed naturally. The sources of that exposure are cosmic rays that come from outer space and from the surface of the Sun, terrestrial radionuclides that occur in the Earth’s crust, in building materials and in air, water and foods and in the human body itself. Some of the exposures are fairly constant and uniform for all individuals everywhere, for example, the dose from ingestion of potassium-40 in foods. Other exposures vary widely depending on location. Exposures can also vary as a result of human activities for example building materials of houses and the design and ventilation systems strongly influence indoor levels of the radioactive gas radon and its decay products, which contribute significantly to doses through inhalation. XI ICFA School San Carlos de Bariloche 11-22 January 2010
Gamma rays from terrestrial sources Naturally occurring radionuclides of terrestrial origin are present in all media in the environment, including the human body itself. Irradiation of the human body from external sources is mainly by gamma radiation from radionuclides in the 238U and 232Th series and from 40K. Indoor exposure to gamma rays, mainly determined by the materials of construction, is inherently greater than outdoor exposure in earth materials have been used; the source geometry changes from half-space to a more surrounding configuration indoors. When the duration of occupancy is taken into account, indoor exposure becomes even more significant. XI ICFA School San Carlos de Bariloche 11-22 January 2010
Instruments and methods Scintibloc is a scintillator cristal NaI[Tl] directly coupled to PhotoMultiplierTube (PMT). NanoSPEC is a NaI(Tl) detector base. It includes HV module, spectroscopic amplifier and MultiChannelAnalyser (MCA). It can be connect to a PC using a serial interface winTMCA32 is the software required to set-up the detector, acquire the gamma ray spectrum from the sample and analyse it.
WinTMCA32: Initialization Before starting the set-up, set the switch of the NanoSpec to: Int • Select the acquisition mode (Acquisition_Mode) on: PHA (pulse height analysis). In this way every value is assigned to one channel and the channel content is incremented by one if a corresponding signal is counted. • Define the Spectrum length (Spectrum_Length): this command changes the number of channels and sub spectra of the actual spectrum. You can select values from the list in the LENGTH field of the input (i.e. 1024, 2048, 4096…) or enter an optimal value (in our case, 2048). • Setup the hardware (Hardware_Setup) : • High Voltage: type the desired voltage value (in our case450 V; WARNING: do not exceed 500 V) in the text field, then confirm the input by pressing the ENTER button. • ULD…: • ULD (upper level discriminator): defines the upper level of the signal acquisition. The settings 0 to 255 don’t belong to a channel directly, but 0 relates to the lowest channel and 255 to the top channel. (set ULD to 255) San Carlos de Bariloche 11-22 January 2010
WinTMCA32: Initialization • LLD (lower level discriminator): discriminates the lowest level of signal acquisition. The settings 0 to 255 are not directly related to to the channels. In order not to discriminate a channel, Set LLD to 0. • Conversion Gain: defines the number of channels for spectra acquisition, thus the relation of channels and voltage. The value varies from 0 to 255. Set Conv. Gain to 0 (this corresponds to a spectrum with 2048 channels). • Noise: defines which of the signals registered are events and which are noise. Only events which give a higher voltage value than the noise value will be registered. In principle Noise works like LLD but events beyond the Noise-level are not considered for the dead time and base line calculations. Set Noise to 0. XI ICFA School San Carlos de Bariloche 11-22 January 2010
WinTMCA32: Initialization • Gain: Sets up the coarse gain for the acquisition hardware. Set the coarse gain to 20 XI ICFA School San Carlos de Bariloche 11-22 January 2010
WinTMCA32: Spectrum acquisition Select window Real timeStatus: STP =acquisition is stopped ACQ=acquisition is active Starts spectrum acquisition Stops spectrum acquisition Erases the actual spectrum Defines spectrum length (2048) Opens the hardware setup menu Integrates the marked area within the actual spectrum Opens a dialog to select spectra files Save the spectrum Show the preset menu XI ICFA School San Carlos de Bariloche 11-22 January 2010
Energy calibration The energy calibration of a spectrum has to be realized with calibration sources. As example we could used a Marinelli calibration source, containing a mixture of nuclides. XI ICFA School San Carlos de Bariloche 11-22 January 2010
Energy calibration procedure • Select Spectrum, ROIs, New. • Define Left Margin and Right Margin using the red marker. • Press Set button and close the window. • With the red marker inside the ROI, use the command Compute, Integrate to determine the Centroid of the peak. • Repeat the procedure for all the available peaks. • Select Spectrum, Energy calibration and insert the data as showed below: XI ICFA School San Carlos de Bariloche 11-22 January 2010
Energy calibration result Remember to write down in another file the energy calibration table, the system cannot save it separately. XI ICFA School San Carlos de Bariloche 11-22 January 2010
Sample analysis • Acquire the spectrum from your sample using the same set up used for the calibration. • Load the energy calibration. • Select Spectrum, ROIs, New. • Define Left Margin and Right Margin using the red marker. • Press Set button and close the window. • With the red marker inside the ROI, use the command Calculus, Integrate to determine:Peak energy, Net area, CPS XI ICFA School San Carlos de Bariloche 11-22 January 2010
Sample analysis • Nuclide search: • - Load the nuclide database • DBEdit: Database_Open: Nuclide.db (Nota: the nuclide database is in in the Folder target/winTMCA32 english/NUCDATA • Use the search command to search by photopeak energy the nuclide (half life and secondary peak emission can help you !) XI ICFA School San Carlos de Bariloche 11-22 January 2010
Sample analysis • Edit your nuclide database: • Create your DB (Dbedit ->new) Import the desired nuclide (Dbedit ->import) Activate the Check field of your DB XI ICFA School San Carlos de Bariloche 11-22 January 2010
Sample analysis • Edit your nuclide database: • Load the nuclide database (C:\Programmi\target\winTMCA32 english\Dbedit.exe ->new) If the peak centroid lies within the range of a peak energy of one of the nuclides in the selected nuclide data base, the name of the nuclide will be displayed. Therefore it is required that the CHECK field of this line in nuclide database is activated. The Bq-field shows the activity calculated from the net count rate; the efficiency factor of the nuclide database line was taken into consideration. XI ICFA School San Carlos de Bariloche 11-22 January 2010
Sample analysis • From the program WinTMCA32, load your nuclide DB in the spectrum (Program->select nuclide database) • Define ROIs. • With the red marker inside the ROI, use the command Compute, Integrate. The program will recognize the matching DB nuclide and will give you the Activity. • PAY ATTENTION THE ACTIVITY HAS TO BE NORMALIZED USING THE EFFICIENCY OF THE DETECTOR. Activity (Bq) = where: Br = Branching ratio = efficiency T = live time Since the efficiency reported in nuclide database is 100%, the activity value provided by software needs to be corrected using the efficiency calibration curve of your detector: Ln(’ )= -4.4364 + 1.436452 Ln(Energy) – 0.21634 ((Ln(Energy))2 Corrected activity = Activity/ ’ XI ICFA School San Carlos de Bariloche 11-22 January 2010
Samples analysis Activity (Bq) = where: Br = Branching ratio = efficiency T = live time Since the efficiency reported in nuclide database is 1, the activity value provided by software needs to be corrected using an efficiency calibration curve: Ln(’ )= -4.4364 + 1.436452 Ln(Energy) – 0.21634 ((Ln(Energy))2 Corrected activity = Activity/ ’ XI ICFA School San Carlos de Bariloche 11-22 January 2010
Efficiency calibration The efficiency calibration of NaI detector has to be realized with calibration sources. As example we could used Marinelli calibration source constituted by radionuclidic mixture. Activity (Bq) = T=72000 s efficiency = ‘= efficiency calibration curve: Ln(’ )= -4.4364 + 1.436452 Ln(Energy) – 0.21634 ((Ln(Energy))2 XI ICFA School San Carlos de Bariloche 11-22 January 2010
Conclusions Give a brief report of your experiment comparing the activity form your sample with the ones of a background spectrum. In which way you can assess the gamma absorbed dose rate? The mass of the detector is 0.378 kg XI ICFA School San Carlos de Bariloche 11-22 January 2010