Download
1 / 59
590 likes | 755 Views
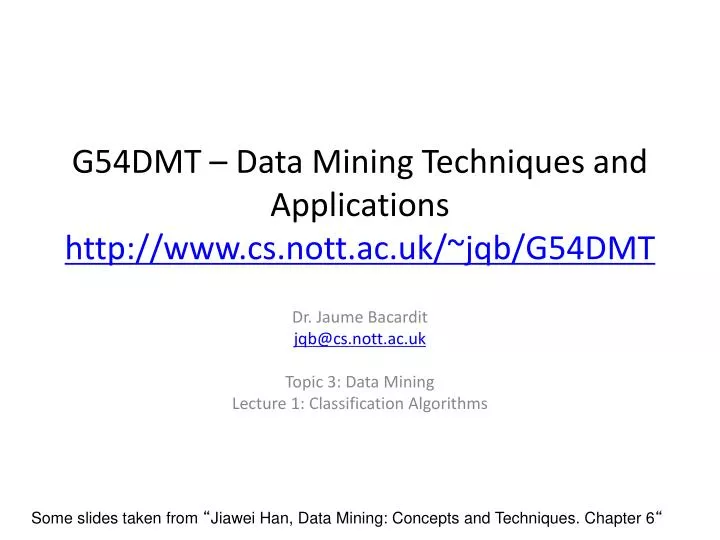
G54DMT – Data Mining Techniques and Applications http://www.cs.nott.ac.uk/~jqb/G54DMT. Dr. Jaume Bacardit jqb@cs.nott.ac.uk Topic 3: Data Mining Lecture 1: Classification Algorithms. Some slides taken from “ Jiawei Han, Data Mining: Concepts and Techniques. Chapter 6 “.

E N D
G54DMT – Data Mining Techniques and Applicationshttp://www.cs.nott.ac.uk/~jqb/G54DMT Dr. Jaume Bacardit jqb@cs.nott.ac.uk Topic 3: Data Mining Lecture 1: Classification Algorithms Some slides taken from “Jiawei Han, Data Mining: Concepts and Techniques. Chapter 6“
Outline of the lecture • Topic presentation • Classification and representations • Classification methods • Decision trees learning • Naïve Bayes • Instance-Based Learning • Rule Induction • Neural Networks • Support Vector Machines • Resources
Outline of the topic • This topic is focused on the central stage of the KDD pipeline: The extraction of patterns from the dataset (a.k.a. Data Mining) • We will cover the main classes of data mining problems • Classification • Regression • Association Rules • Clustering • And how to adapt them to large-scale data mining
Process of supervised learning New Instance TrainingSet LearningAlgorithm Models Inference Engine AnnotatedInstance
Types of supervised learning • If the special attribute is discrete • We call it class • The dataset is a classification problem • If the special attribute is continuous • We call it output • The dataset is a regression problem • Also called modelling or function aproximation
Many types of classification methods (and regression as well) • In the next few lectures we will cover many classification methods • Rule learning, decision trees, bayes learning, neural networks, support vector machines, k-NN, etc. • What makes them different? • Two criteria that define ML methods • Knowledge representation (KR): How is the search space partitioned • Search method. Given a KR, how to find the best partitions
Axis-parallel representations • Treat each attribute separately • Rule-learning, decision trees (not always), Naïve Bayes 1 X X>0.5 X<0.5 Y Y Y<0.5 Y>0.5 0 1 X 1 If (X<0.25 and Y>0.75) or (X>0.75 and Y<0.25) then If (X>0.75 and Y>0.75) then If (X<0.25 and Y<0.25) then Y Everything else Default rule 0 1 X
Nearest-neighbour classifier • Classify new instance based on the training example(s) more similar to the new instance • If k examples are retrieved (k-NN), prediction is a majority vote of the k most similar instances • Space partitioning for the 1-NN is equivalent to generating the Voronoidiagram of the training set 1 • (-0.125,0,yellow) • (0.125,0,red) • (0,-0.125,blue) • (0,0.125,green) Y 0 1
Other representations • Neural Networks and Support Vector Machines (among others) can produce class frontiers that are non-linear (and, of course, oblique)
age? <=30 overcast >40 31..40 student? credit rating? yes excellent fair no yes no yes no yes A decision tree
Algorithm for Decision Tree Induction • Basic algorithm (a greedy algorithm) • Tree is constructed in a top-down recursive divide-and-conquer manner • At start, all the training examples are at the root • Attributes are categorical (if continuous-valued, they are discretized in advance) • Examples are partitioned recursively based on selected attributes • Test attributes are selected on the basis of a heuristic or statistical measure (e.g., information gain) • Conditions for stopping partitioning • All samples for a given node belong to the same class • There are no remaining attributes for further partitioning – majority voting is employed for classifying the leaf • There are no samples left
Attribute Selection Measure: Information Gain (ID3/C4.5) • Select the attribute with the highest information gain • Let pi be the probability that an arbitrary tuple in D belongs to class Ci, estimated by |Ci, D|/|D| • Expected information (entropy) needed to classify a tuple in D: • Information needed (after using A to split D into v partitions) to classify D: • Information gained by branching on attribute A
Class P: buys_computer = “yes” Class N: buys_computer = “no” means “age <=30” has 5 out of 14 samples, with 2 yes’es and 3 no’s. Hence Similarly, Attribute Selection: Information Gain
Computing Information-Gain for Continuous-Value Attributes • Let attribute A be a continuous-valued attribute • Must determine the best split point for A • Sort the value A in increasing order • Typically, the midpoint between each pair of adjacent values is considered as a possible split point • (ai+ai+1)/2 is the midpoint between the values of ai and ai+1 • The point with the minimum expected information requirement for A is selected as the split-point for A • Split: • D1 is the set of tuples in D satisfying A ≤ split-point, and D2 is the set of tuples in D satisfying A > split-point
Gain Ratio for Attribute Selection (C4.5) • Information gain measure is biased towards attributes with a large number of values • C4.5 (a successor of ID3) uses gain ratio to overcome the problem (normalization to information gain) • GainRatio(A) = Gain(A)/SplitInfo(A) • Ex. • gain_ratio(income) = 0.029/0.926 = 0.031 • The attribute with the maximum gain ratio is selected as the splitting attribute
Overfitting and Tree Pruning • Overfitting: An induced tree may overfit the training data • Too many branches, some may reflect anomalies due to noise or outliers • Poor accuracy for unseen samples • Two approaches to avoid overfitting • Prepruning: Halt tree construction early—do not split a node if this would result in the goodness measure falling below a threshold • Difficult to choose an appropriate threshold • Postpruning: Remove branches from a “fully grown” tree—get a sequence of progressively pruned trees • Use a set of data different from the training data to decide which is the “best pruned tree”
Bayesian Classification: Why? • A statistical classifier: performs probabilistic prediction, i.e., predicts class membership probabilities • Foundation: Based on Bayes’ Theorem. • Performance: A simple Bayesian classifier, naïve Bayesian classifier, has comparable performance with decision tree and selected neural network classifiers • Incremental: Each training example can incrementally increase/decrease the probability that a hypothesis is correct — prior knowledge can be combined with observed data
Bayesian Theorem: Basics • Let X be a data sample (“evidence”): class label is unknown • Let H be a hypothesis that X belongs to class C • Classification is to determine P(H|X), the probability that the hypothesis holds given the observed data sample X • P(H) (prior probability), the initial probability • E.g., X will buy computer, regardless of age, income, … • P(X): probability that sample data is observed • P(X|H) (posteriori probability), the probability of observing the sample X, given that the hypothesis holds • E.g.,Given that X will buy computer, the prob. that X is 31..40, medium income
Bayesian Theorem • Given training dataX, posteriori probability of a hypothesis H, P(H|X), follows the Bayes theorem • Informally, this can be written as posteriori = likelihood x prior/evidence • Predicts X belongs to C2 iff the probability P(Ci|X) is the highest among all the P(Ck|X) for all the k classes • Practical difficulty: require initial knowledge of many probabilities, significant computational cost
Towards Naïve Bayesian Classifier • Let D be a training set of tuples and their associated class labels, and each tuple is represented by an n-D attribute vector X = (x1, x2, …, xn) • Suppose there are m classes C1, C2, …, Cm. • Classification is to derive the maximum posteriori, i.e., the maximal P(Ci|X) • This can be derived from Bayes’ theorem • Since P(X) is constant for all classes, only needs to be maximized
Derivation of Naïve Bayes Classifier • A simplified assumption: attributes are conditionally independent (i.e., no dependence relation between attributes): • This greatly reduces the computation cost: Only counts the class distribution • If Ak is categorical, P(xk|Ci) is the # of tuples in Ci having value xk for Ak divided by |Ci, D| (# of tuples of Ci in D) • If Ak is continous-valued, P(xk|Ci) is usually computed based on Gaussian distribution with a mean μ and standard deviation σ and P(xk|Ci) is
Naïve Bayesian Classifier: Training Dataset Class: C1:buys_computer = ‘yes’ C2:buys_computer = ‘no’ Data sample X = (age <=30, Income = medium, Student = yes Credit_rating = Fair)
Naïve Bayesian Classifier: An Example • P(Ci): P(buys_computer = “yes”) = 9/14 = 0.643 P(buys_computer = “no”) = 5/14= 0.357 • Compute P(X|Ci) for each class P(age = “<=30” | buys_computer = “yes”) = 2/9 = 0.222 P(age = “<= 30” | buys_computer = “no”) = 3/5 = 0.6 P(income = “medium” | buys_computer = “yes”) = 4/9 = 0.444 P(income = “medium” | buys_computer = “no”) = 2/5 = 0.4 P(student = “yes” | buys_computer = “yes) = 6/9 = 0.667 P(student = “yes” | buys_computer = “no”) = 1/5 = 0.2 P(credit_rating = “fair” | buys_computer = “yes”) = 6/9 = 0.667 P(credit_rating = “fair” | buys_computer = “no”) = 2/5 = 0.4 • X = (age <= 30 , income = medium, student = yes, credit_rating = fair) P(X|Ci) : P(X|buys_computer = “yes”) = 0.222 x 0.444 x 0.667 x 0.667 = 0.044 P(X|buys_computer = “no”) = 0.6 x 0.4 x 0.2 x 0.4 = 0.019 P(X|Ci)*P(Ci) : P(X|buys_computer = “yes”) * P(buys_computer = “yes”) = 0.028 P(X|buys_computer = “no”) * P(buys_computer = “no”) = 0.007 Therefore, X belongs to class (“buys_computer = yes”)
Avoiding the 0-Probability Problem • Naïve Bayesian prediction requires each conditional prob. be non-zero. Otherwise, the predicted prob. will be zero • Ex. Suppose a dataset with 1000 tuples, income=low (0), income= medium (990), and income = high (10), • Use Laplacian correction (or Laplacian estimator) • Adding 1 to each case Prob(income = low) = 1/1003 Prob(income = medium) = 991/1003 Prob(income = high) = 11/1003 • The “corrected” prob. estimates are close to their “uncorrected” counterparts
Instance-based Learning • Does not generate a model. It uses the training set (sometimes filtered; see the instance selection lecture) instead • k-NN machine learning algorithm: • Given an unlabeled new instance • Select the k instances from the training set most similar to the new instance • What is similar? (next slide) • Predict the majority class from these k instances
Distance functions • Crucial for the performance of these methods • Sometimes weights are added to the distance functions to reflect the importance of the attributes
Rule-based systems • Equivalent in expression power to traditional (axis-parallel) decision trees, but with more flexibility • They produce rule sets as solutions, in the form of a set of IF… THEN rules • IF Predicate1THEN predict C1 • IF Predicate2THEN predict C2 • . • . • IF PredicatenTHEN predict C1
What is a predicate? • A logic statement, generally as boolean logic • Another, quite popular, alternative is using Fuzzy logic • Conjunctive predicate • IfAtt 1 takes value a and Att 2 is between [l,u] … andAtt n takes value cTHEN …. • Conjunctive normal form predicate • If Att1 takes value (a or b) and Att2 takes value (b or c) and …..
Rule sets • Single rules are not the solution of the problem, they are members of rule sets • Rules in a rule set cooperate to solve the problem. Together they should cover the whole search space • Sometimes, more than one rule could be applied to predict an example (matches the example). In this case we have to perform conflict resolution • Establish a hierarchy of rules, that is, prioritise always certain rules. An example of this is a decision list, where the order of the rules in the rule set decides the priority • Choose always the most specific/most general rule • Establish a score for each rule based on past performance, choose the strongest rule • Also, many times a rule set also has a default rule • Everything not predicted by any rule will be assigned to the default class
How to evaluate rules/rule sets • Evaluating rules • A good rule should not make mistakes and should cover as many examples as possible • Accuracy: #C/#M • #C: correctly classified examples • #M: examples matched by the rule • Coverage: #M/#T • #T: examples in the training set • Complexity: Favoring rules with simple predicates • Evaluating rule sets • A complete rule set should be good at classifying all the training examples • Accuracy: #C/#T • #C in this case is the number of correctly classified examples by the whole rule set • Complexity: Favor rule sets with the minimal number of rules • More metrics
How to learn rule sets? • Two families of methods: • Learning rules sequentially, one at a time • Also known as separate-and-conquer (Fürnkranz, 99) • Learning all rules together • Direct rule learning • Deriving rules form decision trees
Separate-and-conquer • Rules are learned sequentially • After each rule is learned, the covered examples are removed from the training set, and the process starts again • Process finishes when there are no more examples to cover
Separate-and-conquer methods • Most popular family of rule learning methods • AQ family of rule induction methods (Michalski, 69) • CN2 (Clask & Boswell, 91) • RIPPERk (Cohen, 95) • Two crucial elements • Algorithm that generates each rule • Criterion to used to accept a new rule • Minimum accuracy and coverage • Accept rules that are better than a default class • Use a validation set of examples, unseen before
CN2 rule generation algorithm • Does not generate rules, generates predicates • The majority class of the examples covered by the predicate will be assigned as the class of the rule • The system will iteratively refine a pool of predicates by specialising them • The initial pool contains an empty predicate, that covers all examples
Learning rules all together • RISE (Domingos, 94) • Hybrid between rule learning and nearest-neighbour classifier • Elements of a rule set can be rules or instances • Match is performed as in a 1-NN. Distance will remain 0 if an example is between the intervals of a rule, and start growing when outside. If the rule is an instance, distance grows from the beginning • Starts with a rule set equivalent to the training set. • Iteratively generalises the instances converting them into rules • Generates unordered rules
Classification: A Mathematical Mapping • Classification: • predicts categorical class labels • E.g., Personal homepage classification • xi = (x1, x2, x3, …), yi = +1 or –1 • x1 : # of a word “homepage” • x2 : # of a word “welcome” • Mathematically • x X = n, y Y = {+1, –1} • We want a function f: X Y
Linear Classification • Binary Classification problem • The data above the red line belongs to class ‘x’ • The data below red line belongs to class ‘o’ • Examples: SVM, Perceptron, Probabilistic Classifiers x x x x x x x o x x o o x o o o o o o o o o o
Neural Networks • Started by psychologists and neurobiologists to develop and test computational analogues of neurons • A neural network: A set of connected input/output units where each connection has a weight associated with it • During the learning phase, the network learns by adjusting the weights so as to be able to predict the correct class label of the input tuples • Also referred to as connectionist learning due to the connections between units
- mk x0 w0 x1 w1 f å output y xn wn Input vector x weight vector w weighted sum Activation function A Neuron (= a perceptron) • The n-dimensional input vector x is mapped into variable y by means of the scalar product and a nonlinear function mapping
A Multi-Layer Feed-Forward Neural Network Output vector Output layer Hidden layer Input layer Input vector: X
How A Multi-Layer Neural Network Works? • The inputs to the network correspond to the attributes measured for each training tuple • Inputs are fed simultaneously into the units making up the input layer • They are then weighted and fed simultaneously to a hidden layer • The number of hidden layers is arbitrary, although usually only one • The weighted outputs of the last hidden layer are input to units making up the output layer, which emits the network's prediction • The network is feed-forward in that none of the weights cycles back to an input unit or to an output unit of a previous layer • From a statistical point of view, networks perform nonlinear regression: Given enough hidden units and enough training samples, they can closely approximate any function
Defining a Network Topology • First decide the network topology: # of units in the input layer, # of hidden layers (if > 1), # of units in each hidden layer, and # of units in the output layer • Normalizing the input values for each attribute measured in the training tuples to [0.0—1.0] • One input unit per domain value, each initialized to 0 • Output, if for classification and more than two classes, one output unit per class is used • Once a network has been trained and its accuracy is unacceptable, repeat the training process with a different network topology or a different set of initial weights
Backpropagation • Iteratively process a set of training tuples & compare the network's prediction with the actual known target value • For each training tuple, the weights are modified to minimize the mean squared error between the network's prediction and the actual target value • Modifications are made in the “backwards” direction: from the output layer, through each hidden layer down to the first hidden layer, hence “backpropagation” • Steps • Initialize weights (to small random #s) and biases in the network • Propagate the inputs forward (by applying activation function) • Backpropagate the error (by updating weights and biases) • Terminating condition (when error is very small, etc.)
SVM—Support Vector Machines • A new classification method for both linear and nonlinear data • It uses a nonlinear mapping to transform the original training data into a higher dimension • With the new dimension, it searches for the linear optimal separating hyperplane (i.e., “decision boundary”) • With an appropriate nonlinear mapping to a sufficiently high dimension, data from two classes can always be separated by a hyperplane • SVM finds this hyperplane using support vectors (“essential” training tuples) and margins (defined by the support vectors)
SVM—History and Applications • Vapnik and colleagues (1992)—groundwork from Vapnik & Chervonenkis’ statistical learning theory in 1960s • Features: training can be slow but accuracy is high owing to their ability to model complex nonlinear decision boundaries (margin maximization) • Used both for classification and prediction • Applications: • handwritten digit recognition, object recognition, speaker identification, benchmarking time-series prediction tests
Small Margin Large Margin Support Vectors SVM—General Philosophy
SVM—When Data Is Linearly Separable m Let data D be (X1, y1), …, (X|D|, y|D|), where Xi is the set of training tuples associated with the class labels yi There are infinite lines (hyperplanes) separating the two classes but we want to find the best one (the one that minimizes classification error on unseen data) SVM searches for the hyperplane with the largest margin, i.e., maximum marginal hyperplane (MMH)