Download
1 / 41
410 likes | 410 Views
Understand what makes customers truly happy and how to measure their satisfaction and loyalty through customer surveys. Learn about common errors in customer surveys and the importance of exceeding customer expectations to secure future commitment. Explore the impact of loyalty on profits and examples of loyalty leaders in various industries.

E N D
. . . evolving customers from highly satisfied to intensely loyal.
What makes customers really happy? • Customer service experience • Ease of doing business • Price versus value • Company reputation
Customer Survey Process Whether surveying for Customer Satisfaction, Loyalty or both . . . GIGO Rules!
Beginning with a solid foundation • Whenever we survey a segment of our customer population about satisfaction or loyalty we are using statistics, or more specifically, Inferential Statistics. • That is, we are inferring something about the entire population by looking at a sample of that population.
But first . . . Some key Inferential Statistics terms • Population (Universe) • All Items of Interest • Parameter • Summary Measure about Population • Sample • Portion of Population • Statistic • Summary Measure about Sample Pin Population & Parameter Sin Sample & Statistic
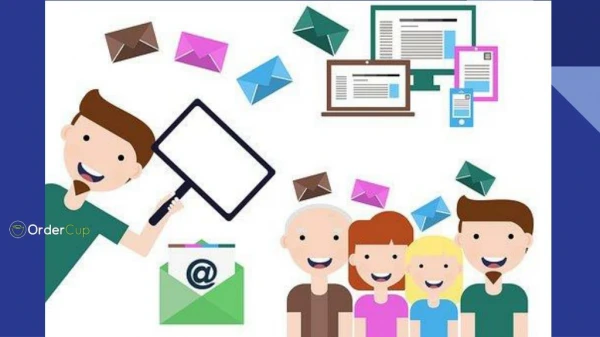
Most Service Vendors have a survey process to measure customer satisfaction • Periodic surveys - Perceptions • Event/Transactional surveys – Actual experience • Establish required sample size, target response rates and confidence level • Quantitative results and verbatim feedback gathered • Results are analyzed and communicated
Common Errors in Customer Surveys Since the usability of any customer survey depends upon the accuracy of the results, error control plays a critical role in the research process. • Sampling Errors The inaccuracy of the results of a survey when a non-random sample of a population is used to infer the satisfaction of the total population. • Only Closes cases • Exclusion period
Respondent Influencing Errors – • Leading the respondent • Leading question by telephone survey interviewer. • Survey wording bias. “We value our highly satisfied customers etc.. • Support representative pleading… “My job depends on your rating”
Questionnaire Structure Errors – • Question Ordering bias . • Overall question • Questionnaire Language error • Ambiguous - Are you satisfied or very satisfied with the support you received? • When respondents purposefully or mistakenly give incorrect answers to survey questions Respondent Error
Customer survey rating scales have “Satisfaction” set at the mid-point or just above Example from seven point scale Extremely Dissatisfied Very Dissatisfied Satisfied Very Satisfied Extremely Satisfied
“TOP BOX” IS SIMPLY A TERM USED TO DESCRIBE THE HIGHEST RATING ON A CUSTOMER SURVEY SCALE • Definition from the “Support Center Practices” Certification program • Highest rated measurement to better understand customer loyalty and retention • Question:“Overall, how satisfied are you with the support provided by your vendor ?”
10-Point Rating Scale 10 Extremely Satisfied Top Box 9 8 7-Point Rating Scale 7 7 Satisfaction 6 6 5 5 4-Point Rating Scale 4 4 4 3 3 3 2 2 2 Extremely Dissatisfied 1 1 1
Now let’s look at the evolution from highly satisfied customers to intensely loyal customers. But, first we must consider . . .?
Satisfaction = Meeting minimum expectation (32% chances of losing customer) Loyalty = Exceeding customers expectation and securing future commitment (0 to 3% chance of losing customers)
Loyalty It costs five to ten times more money to get a new customer than it does to keep the customers you already have John Tschohl, founder and president, Service Quality Institute. 5% increase in customer loyalty can increase profits by 25 to 85% Harvard Business Review
Loyalty Repurchase Rates Customer Satisfaction • Satisfaction scores for the automotive industry have ballooned up to 90%, while repurchase rates have remained mired below 50% . • Bain & Company’s research has shown that in business after business, 60% to 80% of customers who defect to a competitor said they were satisfied on the survey just prior to their defection.
Loyalty . . . and how about employee and investor loyalty? Employee turnover rates of 15-25% are common. Cost of losing a service employee can be as high as $250K Average investor churn now exceeds 50% per year.
Industry Examples & Measures
In 2005, Walker Information conducted a U.S. and European study on customer loyalty in the software and hardware industry.
Of all the major software and hardware companies evaluated as part of this Walker Loyalty Report, just 12 were designated as Loyalty Leaders. Earning high percentages of truly loyal customers, these companies also have relatively low percentages of customers in the high-risk category. The 12 Loyalty Leaders are: Adobe Apple Cisco Systems Dell EMC² Hewlett-Packard IBM Microsoft Oracle SAP Sun Microsystems Symantec
Walker Loyalty Reports categorize Loyalty in four quadrants * Walker Information @ www.walkerinfo.com
Walker Loyalty Reports categorize Loyalty in four quadrants * Walker Information @ www.walkerinfo.com
Hardware Customers / U.S. The U.S. Hardware industry generates less customer loyalty than the Software industry, despite Hardware's higher scores in customer experience areas. This suggests Hardware companies have fewer barriers to switching, more competition, and/or less differentiation. Hardware products are more commodity-like than Software, which is why vendors seek to wrap the products into more consultative solutions for customers.
Software Customers / U.S. Software as a total sector in the U.S. maintains more truly loyal customers than does the U.S. Hardware industry. Europe's Software customers are less truly loyal than the U.S. customers and score similarly to Hardware in Europe. Despite having more loyal customers, Software scores fall slightly below Hardware on company images, and even lower on customer experiences. Within Software, CRM loyalty is slightly below the norm in the U.S., driven by concerns with total cost of ownership and product quality.
How focusing on Customer Loyalty improved results at Cisco Systems* over the past few years. * Wim Elfrink, Senior Vice President of Customer Advocacy, Cisco Systems Keynote Speaker at AFSMI Conference – October 2005
Measuring Customer Loyalty A useful Customer Loyalty Index is the percent of surveys with top box selected on all three of these questions. SCP Support Manager Certification course Reference Workbook Page 5-68
The road to Customer Loyalty at Hewlett-Packard. First time fix rate Highly Satisfied Each of these case attributes were found to be highly correlated with high levels of customer satisfaction. Hold time Time to resolution Quality (monitoring) * ML Krakauer, Vice President & General Manager, Technology Services, Hewlett-Packard Keynote Speaker at AFSMI Conference – October 2005
The road to Customer Loyalty at Hewlett-Packard. Loyalty Index Highly Satisfied The percent of customers that scored a five on all three of these survey questions make up the HP loyalty index. Highly Likely to Recommend Highly Likely to Repurchase * ML Krakauer, Vice President & General Manager, Technology Services, Hewlett-Packard Keynote Speaker at AFSMI Conference – October 2005
McKesson is a client of SatMetrix and uses a variation of the SatMetrix Customer Loyalty Index analysis. The CLI is based typically based on the answers to four questions: • How satisfied are you with this provider’s overall performance? • How likely is it that you would recommend this provider to a friend or colleague? • How likely is it that you will continue to purchase products/services from this provider? • If you were selecting a similar provider for the first time, how likely is it that you would use them? • McKesson only uses the first three questions which are the same as the three questions used at Hewlett Packard and recommended in the SSC Certified Support Managers course.
The SatMetrix CLI analysis separates customers into four categories. • Promoter • High scores on each of the loyalty questions. They are committed customers and are very likely to provide recommendations • Content • Medium to high scores on each of the loyalty questions. Although they are likely to remain loyal, your company should develop action plans so that “Content” customers become “Promoters.” • Disappointed • Average scores on each of the loyalty questions. They are dissatisfied with one component of loyalty, and could be easily lost to competitors if your company does not address their needs. • Lost • Low scores on each of the loyalty questions. They exhibit a high level of dissatisfaction on the loyalty questions. At this point, it is better to concentrate your efforts on customers in the Disappointed or Content categories.
Customer driven, recognizing that our customers determine the definition of value Relentless pursuit of excellence, setting aggressive goals and measuring against progress Innovation, open-minded, willing to embrace new ideas and challenge our current way of doing businessSpeed, acting with a sense of urgency, a bias for action and a passion to win People, sharing respect for one another and a common sense of integrity in our work
The One Number You Need to Grow
The Idea in Brief You only have to ask your customers one question: "How likely is it that you would recommend our company to a friend or colleague?" The more "promoters" your company has, the bigger its growth.
Extremely unlikely Extremely likely Neutral 10 9 8 7 6 5 4 3 2 1 0 Promoter Passive Detractor Calculating your Net Promoter Score Group your customers into "promoters" (extremely likely to recommend), "passively satisfied", and "detractors" (extremely unlikely to recommend). Then subtract the percent-age of detractors from the percentage of promoters.
Rental Cars Wintel PC’s US only Package Delivery Airlines US only Comparing Net Promoter Scores and Financial Results A more sophisticated approach is to use profitability-based segmentation to align customer experience with corporate goals and objectives.
Why businesses loose customers! Market research on lost customers by major companies shows that 14% leave for better product, 9% for cheaper product, 68% because of poor service and/or service provider’s attitude, which can be easily avoided by designing, measuring and monitoring effective customer service process. New slide
Loyalty and the Purchase Cycle Each time a customer buys, he or she progresses through the buying cycle. The first-time buyer goes through five steps. The sequence of purchase, post purchase evaluation, and decision to re-purchase then form a re-purchase loop that is repeated multiple times, during a customer’s relationship with a company and its products and services. Re-purchase Loop Initial Purchase Awareness
Immunity • Inoculated against competitive threats • The big “R’s” • Relationship and revenue • Reference-ability • Repeat business
Loyalty is the commitment you must EARN from your customers in order to maintain an ongoing profitable relationship