Download
1 / 47
510 likes | 729 Views
Lecture (7). Random Variables and Distribution Functions. Random Variables. Parameter that cannot be predicted with certainty Outcome of a random or uncertain process - flipping a coin or picking out a card from deck Can be discrete or continuous Data are usually discrete or quantized

E N D
Lecture (7) Random Variables and Distribution Functions
Random Variables • Parameter that cannot be predicted with certainty • Outcome of a random or uncertain process - flipping a coin or picking out a card from deck • Can be discrete or continuous • Data are usually discrete or quantized • Usually easier to apply continuous distribution to discrete data that has been organized into bins
0 1 2 3 ... Discreteand Continuous Random Variables • A random variable is discrete if it can assume a countable number of values. • A random variable is continuous if it can assume an uncountable number of values. Discrete random variable Continuous random variable After the first value is defined the second value, and any value thereafter are known. After the first value is defined, any number can be the next one 0 1/16 1/4 1/2 1 Therefore, the number of values is countable Therefore, the number of values is uncountable
Probability distribution A probability distribution of X provides the probability of each possible value of the random variable. If PX(x) is the probability that x is the value of the random variable, we know that and that where the summation is over all values that X takes on. This is because these values of X are mutually exclusive and one of them must occur.
7 8 9 10 11 12 6 7 8 9 10 11 5 6 7 8 9 10 8 12 7 9 10 11 1 4 5 6 7 8 9 6 2 5 3 4 5 6 7 8 3 4 2 3 4 5 6 7 4 3 5 2 3 1 2 4 5 6 The sum of numbers showing on two true dices. Probability distribution Examples
The probability distribution can be also presented by a graph. And by a mathematical function:
Examples of Discrete Probability Distributions Uniform Discrete Distribution Bernoulli Distribution Binomial Distribution Poisson Distribution
Uniform Distribution (Discrete Case) All 6 faces of a die: Example: throwing a die.
Bernoulli Distribution The random variable X that takes the values 0 or 1 with probability 1-p and q respectively, i.e. is called a Bernoulli Variable. Example: throwing the coin.
Bernoulli Example Event: Toss 2 Coins. Count # Tails. • Probability distribution • Valuesprobability • 0 1/4 = .25 • 1 2/4 = .50 • 2 1/4 = .25 T T T T
The Binomial Distribution • The binomial experiment can result in only one of two possible outcomes. • Typical cases where the binomial experiment applies: • A coin flipped results in heads or tails • An election candidate wins or loses • An employee is male or female
Binomial Distribution: B(n,p) Consider a random sequence of n Bernoulli trials, each with: Probability of success = p Probability of failure = q= 1-p we evaluate the number of r success in the n trials by the number of combinations. An outcome of the experiment like, Example: throwing the coin several times (n times).
Binomial Experiment • There are n trials (n is finite and fixed). • Each trial can result in a success or a failure. • The probability p of success is the same for all the trials. • All the trials of the experiment are independent. • Binomial Random Variable • The binomial random variable counts the number of successes in n trials of the binomial experiment. • By definition, this is a discrete random variable.
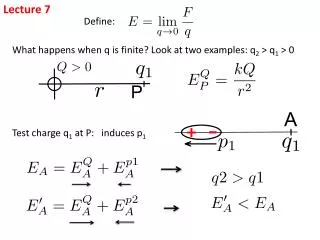
S3 P(S3|S2,S1) P(S2|S1 F3 P(F3|S2,S1) P(S3|F2,S1) S3 P(F3|F2,S1) F3 S3 P(S3|S2,F1) P(S2)=p P(F3|S2,F1) F3 S3 P(S3|F2,F1) P(F2)=1-p P(F3|F2,F1) F3 Developing the Binomial Probability Distribution (n = 3) P(SSS)=p3 S2 P(S3)=p P(S2)=p P(S2|S1) S1 P(F3)=1-p P(SSF)=p2(1-p) P(S3)=p P(SFS)=p(1-p)p P(F2|S1) P(S1)=p P(F2)=1-p Since the outcome of each trial is independent of the previous outcomes, we can replace the conditional probabilities with the marginal probabilities. P(F3)=1-p F2 P(SFF)=p(1-p)2 P(FSS)=(1-p)p2 P(S3)=p S2 P(F1)=1-p P(S2|F1) P(F3)=1-p P(FSF)=(1-p)p(1-p) P(FFS)=(1-p)2p F1 P(S3)=p P(F2|F1) F2 P(F3)=1-p P(FFF)=(1-p)3
Developing the Binomial Probability Distribution (n = 3) P(SSS)=p3 SSS Let X be the number of successes in three trials. Then, P(SSF)=p2(1-p) SS P(X = 3) = p3 X = 3 X =2 X = 1 X = 0 S S P(SFS)=p(1-p)p P(X = 2) = 3p2(1-p) P(SFF)=p(1-p)2 P(X = 1) = 3p(1-p)2 SS P(FSS)=(1-p)p2 P(X = 0) = (1- p)3 P(FSF)=(1-p)p(1-p) P(FFS)=(1-p)2p This multiplier is calculated in the following formula P(FFF)=(1-p)3
Calculating the Binomial Probability In general, The binomial probability is calculated by:
Calculating the Binomial Probability • Example • A student is registered in a statistics course and intends to rely on luck to pass the next quiz. • The quiz consists on 10 multiple choice questions with 5 possible choices for each question, only one of which is the correct answer. • The student will guess the answer to each question • Find the following probabilities • The student gets no answer correct • The student gets two answer correct? • The student fails the quiz
Calculating the Binomial Probability • Solution • Checking the conditions • An answer can be either correct or incorrect. • There is a fixed finite number of trials (n=10) • Each answer is independent of the others. • The probability p of a correct answer (.20) does not change from question to question.
Calculating the Binomial Probability • Solution – Continued • Determining the binomial probabilities: Let X = the number of correct answers
This is called cumulative probability Calculating the Binomial Probability • Solution – Continued • Determining the binomial probabilities: the student fails the test if the number of correct answers is less than 5, which means less than or equal to 4. P(X£4) = p(0) + p(1) + p(2) + p(3) + p(4) = .1074 + .2684 + .3020 + .2013 + .0881 =.9672
Mean and Variance of Binomial Variable E(X) = m = np V(X) = s2 = np(1-p) • Example • If all the students in class intend to guess the answers to the quiz, what is the mean and the standard deviation of the quiz mark? • Solution • m = np = 10(.2) = 2. • s = [np(1-p)]1/2 = [10(.2)(.8)]1/2 = 1.26.
Chart 1 Chart 2
Chart 3 Chart 4
Chart 5 Chart 6
Chart 7 Chart 8
Poisson Distribution • The Poisson experiment typically fits cases of rare events that occur over a fixed amount of time or within a specified region • Typical cases • The number of errors a typist makes per page • The number of customers entering a service station per hour • The number of telephone calls received by a switchboard per hour. • The number of Rainy days in Jeddah within a year.
Properties of the Poisson Experiment • The number of successes (events) that occur in a certain time interval is independent of the number of successes that occur in another time interval. • The probability of a success in a certain time interval is: the same for all time intervals of the same size, proportional to the length of the interval. • The probability that two or more successes will occur in an interval approaches zero as the interval becomes smaller.
The Poisson Variable and Distribution • The Poisson Random Variable • The Poisson variable indicates the number of successes that occur during a given time interval or in a specific region in a Poisson experiment • Probability Distribution of the Poisson Random Variable.
Poisson Distributions (Graphs) 0 1 2 3 4 5
Poisson Distributions (Graphs) Poisson probability distribution with m =2 0 1 2 3 4 5 6 Poisson probability distribution with m =5 0 1 2 3 4 5 6 7 8 9 10 Poisson probability distribution with m =7 0 1 2 3 4 5 6 7 8 9 10 11 12 13 14 15
e-1.51.50 0! e-mmx x! Poisson Distribution (Example 1) • Example • The number of Typographical errors in new editions of textbooks is Poisson distributed with a mean of 1.5 per 100 pages. • 100 pages of a new book are randomly selected. • What is the probability that there are no typos? • Solution • P(X=0)= = = .2231
e-660 0! e-mmx x! = = .002479 Poisson Distribution (Example 2) • Example • For a 400 page book calculate the following probabilities • There are no typos • There are five or fewer typos • Solution • P(X=0)= • P(X£5)=<use the formula to find p(0), p(1),…,p(5), then calculate p(0)+p(1)+…+p(5) = .4457 Important! A mean of 1.5 typos per100 pages, is equivalent to 6 typos per 400 pages.
The difference between Binomial and Poisson distributions. The parameter p and n in the Poisson distribution are dependent. The Binomial distribution is bounded by X=0, X=n with p(X=0)=(1-p)^n and p(X=n)=p^n The Poisson distribution is bounded by X=0 for p(X=0)=e^- The Poisson distribution only the occurrence of an event can be counted; the number of its non-occurrences cannot.
Discrete Bivariate Distributions • The bivariate (or joint) distribution is used when the relationship between two random variables is studied. • The probability that X assumes the value x, and Y assumes the value y is denoted p(x,y) = P(X=x and Y = y)
Bivariate Distributions • Example • X and Y are two variables. Let X and Y denote the runoff and the raifall, respectively. • The bivariate probability distribution is presented next.
Bivariate Distributions 0.42 p(x,y) Example continued X Y 0 1 2 0 .12 .42 .06 1 .21 .06 .03 2 .07 .02 .01 0.21 0.12 0.06 X 0.06 y=0 0.03 0.07 0.02 y=1 0.01 Y y=2 X=0 X=1 X=2
X Y 0 1 2 p(y) 0 .12 .42 .06 .60 1 .21 .06 .03 .30 2 .07 .02 .01 .10 p(x) .40 .50 .10 1.00 P(Y=1), the marginal probability. Marginal Probabilities • Example- continued • Sum across rows and down columns p(0,0) p(0,1) p(0,2) The marginal probability P(X=0)
X Y 0 1 2 p(y) 0 .12 .42 .06 .60 1 .21 .06 .03 .30 2 .07 .02 .01 .10 p(x) .40 .50 .10 1.00 The sum is equal to 1.0 Conditional Probability Example - continued
Excel Application • See Excel
Probability Calculation • Probability: Numerical measure of the likelihood that an event will occur • Some probabilities that can be calculated using Excel: • Binomial Probabilities • Poisson Probabilities • Hypergeometric Probabilities • Normal Probabilities • Exponential Probabilities
Binomial Probabilities • Use BINOMDIST to compute binomial distribution probabilities and cumulative binomial probabilities Cell =BINOMDIST(number_s, trials, probability_s, cumulative) • Calculates the probability that a sequence of independent trials with two possible outcomes will have a given number of successes • Cumulative is either TRUE or FALSE
Poisson Probabilities • Use POISSON to compute Poisson Probabilities Cell = POISSON (x, mean, cumulative) • Shows the probability of x occurrences of an event over a specified interval of time or space
Hypergeometric Probabilities • Use HYPGEOMDIST to compute hypergeometric probabilities Cell =HYPGEOMDIST(sample_s, number_sample, population_s, number_pop) • Computes the probability of x successes (sample_s) in n trials (number_sample) when the trials are dependent • Similar to Binomial except trials are not independent – probability of success changes from trial to trial • Does not compute cumulative probabilities