Download
1 / 61
620 likes | 760 Views
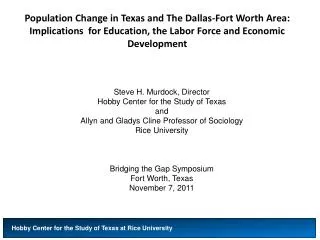
Population Change in Texas: Implications for Human and Socioeconomic Resources in the 21st Century. by Steve H. Murdock Department of Rural Sociology Texas Agricultural Experiment Station Texas A&M University System. Major Demographic Trends Affecting the Future.

E N D
Population Change in Texas:Implications for Human and Socioeconomic Resources in the 21st Century by Steve H. Murdock Department of Rural Sociology Texas Agricultural Experiment Station Texas A&M University System
Major Demographic Trends Affecting the Future • Change in Rates and Sources of Population Growth • Increase in the Non-Anglo Population • Aging of the Population
Total Population and Percent Population Change in Texas and the United States, 1850-2002
Ten Fastest Growing States in Numerical Terms in the United States, 1990-2000
Ten Fastest Growing States in Percentage Terms in the United States, 1990-2000
Texas Rank Among States on Selected Characteristics of Race/Ethnicity Groups
Texas Rank Among States on Selected Characteristics of Race/Ethnicity Groups
Texas Rank Among States on Selected Characteristics of Race/Ethnicity Groups
Numerical Change in Population by Race/Ethnicity in Texas for 1980-1990 and 1990-2000
Percent Change in Population by Race/Ethnicity for 1980-1990 and 1990-2000 in Texas
Proportion of Net Population Change Attributable to Each Race/Ethnicity Group in Texas for 1980-1990 and 1990-2000
Major Changes in Population Composition(Characteristics) • Age
Percent of Texas Population by Age Groupand Ethnicity, 2040*
Median Household Income in 1999 in Texas by Age of Householder Thousands
Median Household Income In 1999 in Texas by Race/Ethnicity of Householder
Educational Attainment in 2000 in Texas for Persons 25+ Years of Age By Race/Ethnicity Percent
States Ranked by Percent High School Graduates + in the Population 25 Years of Age or Older, 2000
States Ranked by Percent College Graduates +in the Population 25 Years of Age or Older, 2000
Population in Texas by Race/Ethnicity in 2000 and Projections of the Population in Texas by Race/Ethnicity from 2010 to 2040
Percent Change for Selected Time Periods for Projected Population in Texas by Racial/Ethnic Status Under Alternative Assumptions of Migration Scenarios
Percent of Population in Texas by Race/Ethnicity in 2000 and Projections of the Percent of the Population in Texas by Race/Ethnicity from 2010 to 2040
Projected Proportion of Population by Race/Ethnicity in Texas, 2000-2040* * Using U.S. Census count for 2000 and Texas State Data Center 1.0 population projection scenario for 2010-2040
Percent of the Projections of the Population by Race/Ethnicity and Age Groups in Texas from 2000-2040 Under Alternative Migration Scenarios
Projected Percent of Net Change Attributable to Each Race/Ethnicity Group in Texas for 2000-2040* * Using U.S. Census count for 2000 and Texas State Data Center 1.0 population projection scenario for 2040.
The Texas Challenge in the Twenty-First Century: Implications of Population Change for the Future of Texas The Center for Demographic and Socioeconomic Research and Education by Steve H. Murdock The Center for Demographic and Socioeconomic Research and Education Department of Rural Sociology Texas A&M University System
Ethnic Diversity of the Population, Householders, and Labor Force in Texas, 2000 and 2040*
Ethnic Diversity of the Population Enrolled in Elementary and Secondary Schools and Colleges in Texas, 2000 and 2040*
Ethnic Diversity of Household Income and Consumer Expenditures in Texas, 2000 and 2040*
State Tax Revenues in Texas Proportioned by Race/Ethnicity in 2000 and Projections to 2040* Assuming 2000 Decile Tax Rates *Projections are shown for the 1.0 scenario
Projected Percent of Labor Force by Educational Attainment in Texas, 2000 and 2040
Average Household Income in Texas, 2000-2040*(in 2000 Dollars)
Projected Percent of Households in Poverty by Family Type in Texas, 2000 and 2040
Percent of Population 25 Years of Age or Older in Texas Who Are High School Graduates and Higher or College Graduates and Higher by Race/Ethnicity, and Percent Change, 1990-2000
Public Community College and University Enrollment Rates (Per 100 Persons Ages 18 to 35) in Texas by Race/Ethnicity, 1990 and 2000
Enrollment in Public Community Colleges andPublic Universities in Texas, 2000-2040*
Percent Change in Projected Public Elementary and Secondary, Public Community College and Public University Enrollment in Texas Assuming Rates of Net Migration Equal to 1990-2000 (1.0 Scenario)
Projected Percent of Public Community College Enrollment by Race/Ethnicity in 2000 and Projections for 2040*
Projected Percent of Public University Enrollment by Race/Ethnicity in 2000 and Projections for 2040*
Number and Percent of Net Change in Projected Public Elementary and Secondary, Public Community College and Public University Enrollment in Texas Due To Each Race/Ethnicity Group, Assuming Rates of Net Migration Equal to 1990-2000 (1.0 Scenario)
Average Annual Household Income in the United States by Educational Attainment* in 2000 *From March 2001 Current Population Survey
Lifetime Household Income in the United States by Educational Attainment* in 2000 *From March 2001 Current Population Survey