Download
1 / 46
460 likes | 558 Views
Examine the Education Data for Georgia. NAEP 2007 4 th Grade Reading At or Above Proficiency. US Average 31% GA Average 28%. Source: National Center for Education Statistics, The Nation’s Report Card. NAEP 2007 8 th Grade Math At or Above Proficiency.

E N D
NAEP 2007 4th Grade Reading At or Above Proficiency US Average 31% GA Average 28% Source: National Center for Education Statistics, The Nation’s Report Card.
NAEP 2007 8th Grade Math At or Above Proficiency US Average 31% GA Average 25% Source: National Center for Education Statistics, The Nation’s Report Card.
SAT 2007 Scores Reading, Writing, Math Composite US Average 1511 GA Average 1472 Source: College Board, 2007 College-Bound Seniors, State and National Reports.
Science Achievement 2007: EOCT Compared to GHSGT Percent Pass or Pass Plus Source: The Governor’s Office of Student Achievement, State Report Cards.
Math Achievement 2007: EOCT Compared to GHSGT Percent Pass or Pass Plus Math tests will change in 2008. Source: The Governor’s Office of Student Achievement, State Report Cards.
Math Achievement by District 2007 GHSGT Math Source: Georgia Department of Education.
Math Achievement by District 2007 EOCT Algebra I Source: Georgia Department of Education.
Georgia High School Graduation Rates Source: The Governor’s Office of Student Achievement, State Report Cards.
High School Graduation Rates: State-by-State Rankings US Average 74.3% GA Average 61.2% Source: NCES The Condition of Education 2007 (2004 Data)
Annual Income Comparisons and Unemployment Rate
Percent of Adults 25 Years and Older without High School Diploma Source: Phyllis Isley and Jeremy R. Hill, “The Economic Impact of High School Non-Completion in Georgia,” Georgia Southern University, August 2003.
Unemployment Rates by County Source: Phyllis Isley and Jeremy R. Hill, "The Economic Impact of High School Non-completion in Georgia," Georgia Southern University, August 2003.
Economic Impact of High School Non-Completion How much could YOUR region benefit from this additional income currently being foregone? *According to GSU study, totals may not add due to rounding. Source: Phyllis Isley and Jeremy R. Hill, “Updated Economic Impact of High School Non-Completion in Georgia: 2005 Estimate,” Georgia Southern University April 2007.
Compounded Impacts of High School Non-Completion IndividualsThe Community Reduced buying power, reduced tax revenues, and less economic growth Lower Lifetime Earnings Decreased health status, higher mortality rates, more criminal activity Higher health care and criminal justice system costs Higher rates of teen pregnancy and single motherhood Higher public services costs Less voting and volunteering Less community involvement Source: Levin, H., et al., “The Costs and Benefits of an Excellent Education for All of America’s Children,” Teachers College, January 2007.
Improving the HS Completion Rate and Workforce Readiness 1. Early Life Experiences 2. Academic Achievement K-12 3. Teaching Quality
Improving the HS Completion Rate and Workforce Readiness 1. Early Life Experiences 2. Academic Achievement K-12 3. Teaching Quality
Family Income Impact on Student Readiness for Kindergarten Source: U.S. Department of Education, National Center for Education Statistics, Early Longitudinal Study, Kindergarten Class of 1998-99.
Perry Preschool Study: Economic Effects Source: Schweinhart, L.J., Montie, J., Xiang, Z., Barnett, W.S., Belfield, C.R., & Nores, M. (2005). Lifetime effects: The High/Scope Perry Preschool study through age 40. High/Scope Press.
Perry Preschool Study: Educational Effects Source: Schweinhart, L.J., Montie, J., Xiang, Z., Barnett, W.S., Belfield, C.R., & Nores, M. (2005). Lifetime effects: The High/Scope Perry Preschool study through age 40. High/Scope Press.
Improving the HS Completion Rate and Workforce Readiness Early Life Experiences 2. Academic Achievement K-12 3. Teaching Quality
Cost of Student Retention You Do the Math for Your Community…
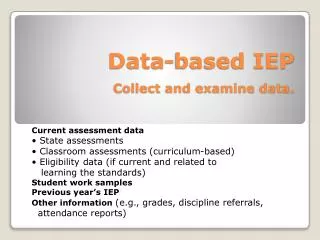
Academic Achievement Milestones • School Readiness • Literacy by 3rd Grade • Numeracy by 8th Grade • High School Graduation Workforce and/or College Ready…
Essential Building Blocks of High Performing States • Higher Standards • Rigorous Curriculum • Clear Accountability System • Statewide Student Information System • Leadership Training
Comparing Achievement in Georgia: 3rd Grade Reading CRCT * Test changed in 2006 with new standards. Source: The Governor’s Office of Student Achievement, State Report Cards.
Comparing Achievement in Georgia:8th Grade Math CRCT * Test will change in 2008 with new standards. Source: The Governor’s Office of Student Achievement, State Report Cards.
Comparing Achievement in Georgia:High School Graduation Source: The Governor’s Office of Student Achievement, State Report Cards and AYP Reports.
Improving the HS Completion Rate and Workforce Readiness Early Life Experiences 2. Academic Achievement K-12 3. Teaching Quality
Low-Achievers become High-Achievers with Effective Teachers Pass rates of previous low-achieving students according to the effectiveness of their teachers Previous low-achievers with 3 ineffective teachers Previous low-achievers with 3 effective teachers Source: “The Real Value of Teachers,” Thinking K-16, 2004.
The Other Dropouts: Loss of Our New Teachers After… Source: Richard Igersoll, “Is There Really a Teacher Shortage?” Center for the Study of Teaching and Policy: University of Washington, Sept 2003.
Teacher Working Conditions Survey Which aspect of your work environment most affects your willingness to keep teaching at your school? Source: Georgia BellSouth Quality Learning and Teaching Environments Initiative, 2006.
Steps Georgia Can Take Now To Improve Teacher Quality • Recruit • Mentor • Retain • Train Source: Georgia Partnership for Excellence in Education, “Gap Analysis: Georgia’s Unfinished Business in Teacher Quality,” 2007.
Action Steps • Analyze State and Local Data (FCP) • Volunteer as a Community Coach or JA Instructor • Mentor, Tutor, Read • Assist with business process reviews • Support the Teacher Quality Project • Host a Local Economics of Education Session • Align your activities with the school/system strategic plan
2006 CRCT Systems Comparisons Muscogee County Schools All Students – 3rd Grade Reading Source: www.georgiaeducation.org
2006 CRCT Systems Comparisons Muscogee County Schools All Students – 8th Grade Math Source: www.georgiaeducation.org
2006 SAT Systems Comparisons Muscogee County Schools All Students – Total Combined SAT Source: www.georgiaeducation.org
Action Steps • Analyze State and Local Data (FCP) • Volunteer as a Community Coach or JA Instructor • Mentor, Tutor, Read • Assist with business process reviews • Support the Teacher Quality Project • Host a Local Economics of Education Session • Align your activities with the school/system strategic plan
Random Acts of Improvement Aligned Acts of Improvement Aligning Educational Strategies GOALS GOALS
Now It’s Your Turn -- Take Action! • Convene • Connect • Commit
What Can We Do? www.gpee.org