Download
1 / 36
360 likes | 505 Views
KGA172 Space, Place and Nature. Spatial Technologies. Dr Christopher Watson. Part 1. Looking back, looking forward. Revisiting Spatial Data. Spatial data comprise information about the location, attributes and relationships between geographic features.

E N D
KGA172 Space, Place and Nature Spatial Technologies Dr Christopher Watson
Part 1 Looking back, looking forward
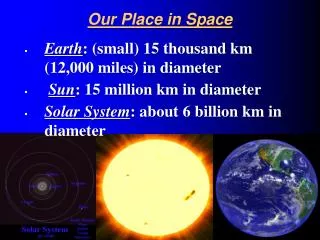
Revisiting Spatial Data • Spatial data comprise information about the location, attributes and relationships between geographic features. • Location(easting, northing and height) and attributes(soil type, vegetation type, land use, ownership, legal rights…) • Data characteristics: points, lines, polygons, raster images … • The goal is to transform datainto informationto use with knowledge and wisely to provide answers to real world problems.
RevisitingAccuracy in Mapping • Accuracy and precision • Scale • Resolution • Lineage • Currency • Standards • Metadata!
Revising Lectures 1.2 and 1.3 Revisit all the new terms you have learned in Lecture 1.2. Can you competently and quickly define them two weeks later? Now focus on the following terms from Lecture 1.3 on accuracy in mapping: Accuracy and precision Scale Resolution Lineage Currency Standards Metadata Can you define each of these and provide examples of HOW they can be used? A Woman Thinking
Learning Objectives Module 1 Lecture 4 KGA172 Know and be able to (a) employ basic geographical terminology and concepts, (b) find, evaluate, analyse and reference appropriate literature, (c) contribute to debates about development and sustainability Comprehend and be able to explain spatial patterns, generate basic maps, field sketches and graphs, and communicate in written and graphical forms Apply key academic skills and (a) engage in critical thinking, discussion and listening, and in self-reflection and reflection upon the viewpoints of others and (b) research, plan and conduct fieldwork to collect data Analyse and interpret basic spatial, numerical and qualitative information Synthesize and integrate knowledge of social and Earth systems • be able to • demonstrate a capacity to explain how and why spatial data may be collected at very different scales – both spatial and temporal • describe the major tools used by spatial scientists and explain how those tools assist with problem solving in various areas of concern • show a deepened understanding of location and attribute as key spatial concepts
Textbook Reading Bergman and Renwick (2008) Chapter 1 Critical reading What is the author’s purpose? What key questions or problems does the author raise? What information, data and evidence does the author present? What key concepts does the author use to organize this information, this evidence? What key conclusions is the author coming to? Are those conclusions justified? What are the author’s primary assumptions? What viewpoints is the author writing from? What are the implications of the author’s reasoning? [from Foundation for Critical Thinking] Old Woman Reading a Lectionary, Gerard Dou
Part 2 Spatial technologies
Think yourself into the space … • Take a minute to think of an application or problem that would require spatial data. Make a note of the application you select. • For example, choose an application from: • Environmental management • Resource management • Urban infrastructure planning or management
Now think about the spatial data that your application might require. • For example: • Terrain height, slope or aspect • Vegetation type or health • Forest canopy attributes • Demographics (if so, what?) • Make a note of the data you may need.
Now suggest sensible characteristics for the data you require: • What data do you need? (location, height, various attributes) • What is the spatial extent? (possible dimensions of your study site) • What spatial resolution do you need?(0.1 m, 1 m, 10 m, 1 km …) • What spatial accuracy do you need?(0.1 m, 1 m. 10 m, 1 km …) • What temporal sampling do you need?(hourly, daily, weekly, annually, or “one-off”)
Surveyor’s level Used to measure heights over short distances
Coastal Inundation – an example where accurate heights are required
Coastal Inundation II ~7m below sea level
Coastal Inundation III Source: Richard Mount
Modern theodolite/total station Measures angles and distances Used for land surveying, engineering surveying, mine surveying Used to produce large scale topographic maps
Global Positioning System (GPS) Measures location on Earth using the U.S. Global Positioning System Currently, accuracy varies between approximately 10 metres to a few millimetres, depending on the equipment and techniques Look forward to the time when we have sub 5 cm accuracy Australia-wide!
Terrestrial laser scanners Scans a region within about 200 m of the instrument Collects a “point cloud” of 3-dimensional data
Close-range photogrammetry Uses a camera to capture multiple views of a scene Measurements from the photos are used to reconstruct the scene
Aerial photogrammetry Uses large format cameras mounted in aircraft. Increasing use of large format and small format digital cameras. Used to map the terrain in 3-dimensions. Used to produce “orthophotos”. Sometimes uses video cameras.
Airborne laser scanning Uses a laser scanner mounted in an aircraft Scans the terrain beneath the aircraft Collects about 50,000 terrain points per second Used to map the terrain in 3-dimensions Used when very high accuracy terrain models are needed
Multispectral and hyperspectral satellites Sensors are mounted on orbiting satellites Image data is collected at a great variety of spatial resolutions and spectral resolutions Ground pixels sizes vary between 30 metres and 0.6 metre for the sensors commonly used
Active Radar satellites Active sensors are mounted on orbiting satellites. Used for terrain mapping
Geographic Information Systems (GIS) The software used to manage, manipulate, analyse, visualise and present spatial information
GIS II Data Management • Spatial data for a single, discrete project • Corporate GIS for an entire organisation Data Analysis • Simple queries (such as “Where is?”) • Complex analysis (“What if?” queries) Data Visualisation • Data displayed on ‘traditional” map sheets • Complex data (3-dimensional or 4-dimensional such as change over time) displayed using more sophisticated techniques
SUMMARY: Some characteristics that emerge • Spatial data can be collected at very different spatial scales • micron resolution at millimetre scales, or • kilometre resolution over 1000 km scales • Spatial data can be collected at very different temporal scales • millisecond resolution, or • 10-year resolution • Spatial data comprises location specific information (East/North, Latitude/Longitude) and attribute information • The attribute information can be • very simple, or • very complex
What technology to choose? • Field surveying instruments (levels, tapes, theodolites, GPS)? • Airborne mapping instruments (cameras, airborne laser scanner)? • Satellite mapping sensors? • GIS for data management, analysis or display? Choose the technology appropriate to given data requirements of your application and consider issues such as scale, extent, resolution, accuracy, timeliness or cost.
An example: Coastal wetlands, vegetation change and exposure to sea level rise • Local focus – e.g. Derwent Marshes. 15 km in extent • Sea level component requires accurate information on height of ground level. Airborne laser scanning? Ground truth data? Levelling/GPS? • Vegetation component requires information over time – historic time series of aerial imagery? Classification? In-situ surveys of vegetation type? Existing data? Tas-Veg? • Resolution of satellite data probably too coarse • Tidal range data www.bom.gov.au • Sea level change scenarios www.ipcc.ch • Combine data into GIS. Compare vegetation communities with surface elevation. Determine at-risk regions based on sea level rise scenarios.
Extended reading Parks, Lisa (2001) Satellite Views of Srebrenica: Tele-visuality and the Politics of Witnessing, Social Identities7 (4) pp.585-611.