Download
1 / 20
200 likes | 694 Views
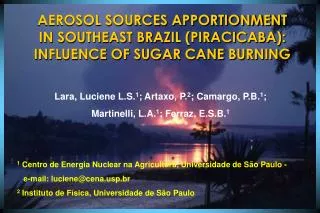
AEROSOL SOURCES APPORTIONMENT IN SOUTHEAST BRAZIL (PIRACICABA): INFLUENCE OF SUGAR CANE BURNING. Lara, Luciene L.S. 1 ; Artaxo, P. 2 ; Camargo, P.B. 1 ; Martinelli, L.A. 1 ; Ferraz, E.S.B. 1 1 Centro de Energia Nuclear na Agricultura, Universidade de São Paulo - e-mail: luciene@cena.usp.br

E N D
AEROSOL SOURCES APPORTIONMENT IN SOUTHEAST BRAZIL (PIRACICABA): INFLUENCE OF SUGAR CANE BURNING Lara, Luciene L.S.1; Artaxo, P.2; Camargo, P.B.1; Martinelli, L.A.1; Ferraz, E.S.B.1 1 Centro de Energia Nuclear na Agricultura, Universidade de São Paulo - e-mail: luciene@cena.usp.br 2 Instituto de Física, Universidade de São Paulo
Area: 12.400 km2 Population: 2.800.000 Counties: 61 The second most developed area of São Paulo State. Equator Brazil Capricorn State of São Paulo Piracicaba Basin Piracicaba Piracicaba River Basin - Geographical Location
1978 1978 1993 Basin area (%) 80 60 40 20 (%) 0 -20 Sugar Crops Citrus Urban Forest Pasture Silviculture -40 -60 -80 Changes in Land-Use in the Piracicaba Basin 19 years later 1993 1997
The sugar cane burning season extends every year from May to November. Approximately 20 tons of sugar cane per hectare is burned. 100,000 tons of organic matter or 50,000 tons of C per year. In Brazil 22% of all gasohol is actually ethanol from sugar cane.
800 250 200 600 150 Precipitation (mm) 400 Number of fire spots 100 200 50 0 0 Jul Jan Sep Mar Nov May May Number of Hot Spots in the State of São Paulo August Data from INPE (www.inpe.br)
Rain Water sources in the Piracicaba Basin Bragança: Soil dust Sugar cane burning Santa Maria: Sugar cane burning Soil Campinas: Industrial emissions Sugar cane burning Piracicaba: Sugar cane burning Soil
Acid rain in Piracicaba River Basin Bragança: pH = 4.7 DOC Santa Maria: pH = 4.9 DOC, NO3- Campinas: pH = 4.4 SO42-, NO3- Piracicaba: pH = 4.8 DOC, NO3-
WET DEPOSITION * Lara et al., 2001 ** Willians et al., 1997 *** Pauliquevis et al., 2002
Relative sources of nitrogen to the Piracicaba River basin After Filoso et al. (2002) - Biogeochemistry
Differences between forest and sugar cane fires Forest mostly in smoldering200 to 300 tons C /ha Sugar cane very fast and all in flaming phase 20 tons/ha = 0.5 tons C/ha
250 PM2.5 200 CPM Mass concentration (µg.m-3) 150 100 50 0 12 10 8 BC concentration (µg.m-3) 6 4 2 0 Mar Apr May Jun Jul Aug Sep Oct Nov Dec Jan Feb PM10 and Black Carbon concentration in Piracicaba Concentration Averages: Dry Season: PM2.5 = 22.7 g.m-3 CPM = 68.1 g.m-3 BC = 4.2 g.m-3 Wet Season: PM2.5 = 11.6 g.m-3 CPM = 22.6 g.m-3 BC = 2.1 g.m-3
80 70 PM10 concentration (µg.m-3) 60 50 40 30 20 7 6 Burning Season Non Burning Season 5 BC concentration (µg.m-3) 4 3 2 1 0:00 2:00 4:00 6:00 8:00 10:00 12:00 14:00 16:00 18:00 20:00 22:00 Diurnal cycle for PM10 and BC concentrations
PM2.5 10000 CPM Concentration (ng.m-3) 1000 100 10 1 10000 PM Mg Al Si P S Cl K Ca Ti V Cr Mn Fe Ni Cu Zn Br Pb 1000 100 10 1 V K Al P S Cl Ti Ni Zn Br Si Ca BC Cu Mg Mn Cr Fe Pb CPM PM10 PM2.5 Aerosol elemental composition in Piracicaba Burning Season Non Burning Season PM 2.5 Concentration (ng.m-3)
Others 4% Biomass burning 25% CPM (2.5<dp<10 µm) Soil 51% Industries 20% Piracicaba quantitative aerosol source apportionment Others 2% Oil Combustion 12% PM2.5 Biomass burning 60% Industries 12% Soil 14%
Piracicaba quantitative BC source apportionment Oil Combustion 12% Others 2% Industries 12% Biomass burning 60% Soil 14%
Stable Isotopic Composition of Aerosol in Piracicaba,Sao Paulo and Santarem δ 13 C values of aerosol particles in: Piracicaba: -20.9 ± 0.8 ‰ Sao Paulo: -24.6 ± 0.3 ‰ Santarem: -25.8 ± 0.5 ‰ Data from: Martinelli et al., Atmospheric Environment, 2002 Lara et al., Atmospheric Environment, (Submitted)
Percentage increases (%) in child respiratory hospital admissions at Piracicaba 95 75 55 % Increase 35 15 -5 P S Si K Al Br Mg BC PM2.5 Burning Season Non Burning Season
New Sampling sites in the State of São Paulo Pasture Perennial Forest Sugar cane Reforestation Water bodies Annual crops Bare soil Urban area Others