Download
1 / 28
280 likes | 360 Views
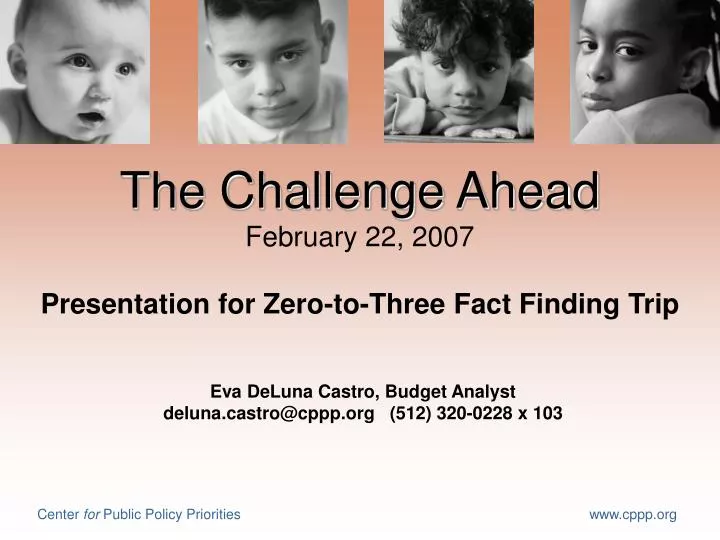
The Challenge Ahead February 22, 2007 Presentation for Zero-to-Three Fact Finding Trip. Eva DeLuna Castro, Budget Analyst deluna.castro@cppp.org (512) 320-0228 x 103. Outline. Growing Needs/Needs of Zero to Three

E N D
The Challenge AheadFebruary 22, 2007Presentation for Zero-to-Three Fact Finding Trip Eva DeLuna Castro, Budget Analyst deluna.castro@cppp.org (512) 320-0228 x 103
Outline • Growing Needs/Needs of Zero to Three • Current programs and levels of investment; likelihood of major changes in 80th Session • Long-term Challenge: Tax Reform
Texas: A Young, Fast-Growing State • Texas has 6.4 million children, second only to California (9.7 million). • Texas is almost tied with California in child population growth from 2000 to 2005. Our child population grew by 417,000, vs. 428,000 for CA • Texas child pop. grew 7% from 2000-05,behind GA (8.4%), NC (8.4%), FL (11%), AZ (14.7%), NV (20%). • Children are 27.7% of the state’s residents.Only Alaska (28.4%) and Utah (30.1%) are younger. • By 2040, school enrollment projected to double.
With High Needs • Almost one-fourth of Texas children live in poverty (less than $17,170 for a family of 3) • Another fourth live in homes that are economically disadvantaged • Highest percentage of children without health insurance • Limited English Proficiency students: 1996-97 = 514,139 (13.4%); 2006 = 711,237 (15.8%) 38% growth in the total, 18% growth in the rate
A Closer Look at Texans Ages 0-3: By Ethnicity and Income/Poverty, 2004-05 52% of Texas’ 1.5 million Zero to 3-Year Olds are “Low Income” (Below 200% of Poverty)
Texans Ages 0-3: By Health Coverage and Income/Poverty, 2004-05 19% of Texas’ Zero to 3-Year Olds are uninsured. Medicaid/CHIP are covering most low-income kids; employer-sponsored or other private coverage reaches most kids at higher income levels.
Texans Ages 0-3: By Family Type, 2004-05 56% of Children Up to Age 3 in Female-Headed Families Live In Poverty, Compared to 17% in Two-Parent or 29% in Male-Headed Families
Enrollment Trends in Child Care and Pre-Kindergarten PreK: As % of 3 and 4 Year Olds Child Care: As % of 0 to 12 Year Olds In 2005, 46% of Texas children served by the federal child care block grant were under 4 years old. US Average: 40%.
Pre-K, Early Education, and ECI Comprehensive Services Pre-Kindergarten ECI Services (for 0-2 Year Olds) Early Education Early Education programs through school districts have seen no enrollment growth, but ECI and Pre-K have grown
Child Protection: Confirmed Victims of Abuse/Neglect Zero-to-Three Age group is becoming a larger share of Texas’ children who are confirmed to be victims of abuse or neglect
Child Protection: Foster Care Zero-to-Three Age group also a larger part of Texas’ foster care caseload
Texas Invests Less than Other States State and Local Own-Source Revenue as a Percent of Personal Income, 2004 Local only: 10th (7.3%) State only: 49th (6.7%) 1% of Personal Income = $7 B
Texas Spending Is Flat Sources: U.S. Census Bureau; Comptroller of Public Accounts
What State Government Pays For Source: U.S. Bureau of the Census, StateGovernment Finances series. Data for 2004 for Texas, total expenditures (including trust) of $77.3 billion.
What Local Government Pays For Source: U.S. Bureau of the Census, Government Finances series. Data for 2004 for Texas, total expenditures (including trust) of $85.7 billion.
How Can There be a “Surplus” in a Low-Spending State? For 2006 and 2007, the Comptroller reports $68.2 billion in general spending, For 2008 and 2009, the Comptroller projects $82.5 billion in general revenue And $82.5 B revenue, 08-09 - 68.2 B spent, 06-07 $14.3 billion “surplus”
What a “Current Services” Proposal Would Have Done with $14.3 Billion (public employee pay/ health ins./pension; prisons; all other) (would restore state parks funding; utility discount; more)
What the Proposed State Budget Would Do with the $14.3 Billion 41% of revenue ($5.8 billion) would not increase state spending
What Would the Proposed 2008-09 Budget Do for Basic Services? • K-12: Cuts to Student Success Initiative ($31.8 million less); pre-K grants (-$18.4 m); Reading, Math & Science Initiatives (-$3.4 m); Master Teacher Grants (-$2.7 m) • Cover caseload increases in Medicaid and CHIP, but not cost increases (need another $1.6 billion GR for that) • Provide funds needed to keep Child Protective Services reform at 2006-07 levels, but not to further reduce caseloads, improve foster care/other provider rates, etc. • Higher Ed: Texas Grants would reach only 47,852 students by 2009, a 22% drop from 61,067 in 2006
What Else Would the Proposed Budget for 2008-09 Do? • Cut General Revenue Funding for community & other public two-year colleges and 43 state agencies(22 General Government & Regulatory, 5 Judiciary, 4 Public Safety/ Corrections; 7 Natural Resources; 5 Business/Economic Development) • Not completely make up for loss of federal funds for child support enforcement • Cut TANF cash assistance funding by 11 percent; caseloads drop 4 percent (to 131,820 by 2009) • Cuts child care slots for “working poor” families from 104,439 in 2006 to 96,964 in 2009 (7% cut)
Cost of Reducing School Property Taxes Compared to New Revenue $5.2 billion gap $5.8 b gap
From a Taxpayer’s Point of View Sources: Comptroller of Public Accounts, Annual Property Tax Report; Cash Report.
Indicators of Ability to Pay Sources: Bureau of Economic Analysis and the Census Bureau.
Households with the Lowest Income Pay the Highest Percentage in State and Local Taxes
The Top One-Fifth of Texas Households Pays Less Than Its Fair Share of Taxes