Download
1 / 38
390 likes | 627 Views
Update on the NEXRAD Turbulence Detection Algorithm. John K. Williams, NCAR/RAL. NEXRAD Technical Advisory Committee Meeting November 1, 2006. For the latest version of this presentation, please see ftp://ftp.rap.ucar.edu/pub/jkwillia/NTDA/TAC/. Outline.

E N D
Update on the NEXRAD Turbulence Detection Algorithm John K. Williams, NCAR/RAL NEXRAD Technical Advisory Committee Meeting November 1, 2006 For the latest version of this presentation, please see ftp://ftp.rap.ucar.edu/pub/jkwillia/NTDA/TAC/
Outline • Review of NTDA objectives and concept of use • Summary of recent milestones • Summer 2006 demonstration • Cockpit uplink demo feedback • Statistical comparisons • Case studies • Algorithm changes • Implementation optimization • ORDA data quality issues • Future research and algorithm improvement
The Turbulence Problem • Turbulence accounts for 70% of weather related aviation injuries. CAST/JSAT study, 2001 • The annual cost of turbulence is $185 million. MCR Federal, 2003 • Severe turbulence PIREPs number 5,500 per year. • Over 60% of turbulence encounters are associated with thunderstorms.
The NEXRAD Turbulence Dectection Algorithm (NTDA)A fuzzy logic algorithmthat produces eddy dissipation rate and confidence estimates
NTDA Objectives • Provide a high-resolution, rapid-update atmospheric turbulence intensity detection capability for aviation using NEXRAD radar data. • Make in-cloud turbulence intensity data available with minimal latency to airline meteorologists, dispatchers, pilots, air traffic controllers, and private weather services providers for tactical decision support. • Improve situational awareness, airspace utilization, and safety.
JPDO Vision: Weather Assimilation into Decision Loops Common weather picture across Next Generation Air Transportation System Fuse multiple weather observations and forecasts into single national database, dynamically update as needed Learning automation accounts for weather and its uncertainties in managing aircraft trajectories Identify hazardous weather real-time Slide courtesy of JPDO
NTDA operational concept Polar Data Available to WARP, CIWS, ITWS, AWIPS NEXRAD Turbulence Detection Algorithm CONUS 3-D EDR Grids (mosaic at NCEP) EDR Grids Available to Other Users Convective Weather Nowcasts Integrated Turbulence Diagnosis and Nowcast Algorithms In situ EDR FAA Turbulence Nowcast (GTG-N on ADDS) Satellite Radar Reflectivity NWP model (WRF) GTG = Graphical Turbulence Guidance, ADDS = Aviation Digital Data Service (see http://weather.aero)
GTG-N operational concept GTG grids CIT diagnostics Satellite data Conv. Wx nowcasts Graphic courtesy of virtualskies.arc.nasa.gov Cockpit display or alert ADDS: Dispatch, ATC, etc. In-situ reports, PIREPs, MDCRS winds and temperatures GTG-N NTDA grids
Recent NTDA milestones • 21 October 2004 – TAC Information Briefing • 21 March 2006 – TAC Decision Briefing • NTDA science deemed adequate for operations, but clear FAA requirement needed • 6 April 2006 – CCR #NA06-09601, “IMPLEMENTATION OF THE NEXRAD TURBULENCE DETECTION ALGORITHM (NTDA) IN THE NEXRAD OPEN RPG” signed and submitted • 20 April 2006 – DAR telecon with ROC, OS&T, and FAA participants • 2 May 2006 – SREC briefing via VTC • CPU and product size goals set (< 10s, <100 kB/volume) • FAA requirement still needs to be established • 23 May 2006 – FAA TTWG briefing via telecon • 6 June to 28 October 2006 – Real-time NTDA demo • LDM data from 24 NEXRADs processed and mosaicked • real-time turbulence mosaic display and cockpit uplinks • 29 September 2006 – SREC implementation performance goals met • 4 October 2006 – PMC accepts NTDA for ORPG Build 10.0
NTDA Demo: Java Web-Accessible Display NTDA turbulence, 0040 UTC on 27 July 2005 Moderate turbulence Severe turbulence In situ turbulence reports Vertical cross-sections of turb. and refl.
Custom Text-Based TurbulenceUplink Maps Flight information • /EXPERIMENTAL TURBULENCE FI UAL███/AN N███UA UPLINK • -- 05 Sep 2006 21:38:13Z FL 300 orient. 83 deg • '+'=waypoint, '*'=route, 'X'=aircraft at 38.3N, 80.6W • ' '=no_data, 'o'=smooth, 'l'=light, 'M'=mod, 'S'=severe • -----------------------(52 to IAD)------------------------ • | * • | * • MM | * • MM | * • MM | l lll M * • MMM | lollo * • lMl | oolo * • l | oo * • | * • |080 * • M |llllllll ll * • MM |lllllllllllllll l * • lll |lllllllllollllllll * • MMl l |MMllllllllooollllll * • MMl l |MMMl lllllllllollll * • MM l |MMMM llll llol ll * • MM | MMMM ll * • MMS | MMM * • MSS | MM * • MSS +PUTTZ + • MSS | * SSSSSS • MSS M | l S*SSSSSSSSS • MSS M | lllS*SSSMSSSSS • MSS l | lSMS*SMMMMSSSS • MSS l | SSMM*MMMMMMMM • MSS M | MM*SMMMMMMMMlllll • MSS M | M*SSMMMMMMMMllllll • MMM M | *MMMMMMMMMMMMMllll • MMM | * MMlllMMMlMllllllM • lll |040 * lllllllllllllllllMMl • lll | * llllllllllllll • llS | * llllllllll • MMS | * lllllll • SSS | * lllll • SSS | * lll • MMS | * l ll • MM | * • MM M | MM*MM o • MSS | SM*MM • MMM | MM *MM l • MM | MMMSS S * l l • lM | MMMSSM * lllllll o • l |l MMMM * lllllo • | MMMMM * llllll • | M * lllll • | SSS * llll • ll | SSS M l * l • lll | SSS Mlllll * • llM | MM lMlllll * l • -------|---------valid-|--------X--------|---------------- • -90 +90|Left 40 2135Z (18 from 3819N/8058W) Right 40 Legend Route Waypoint Severe turbulence Moderate turbulence Aircraft position Vertical cross-section
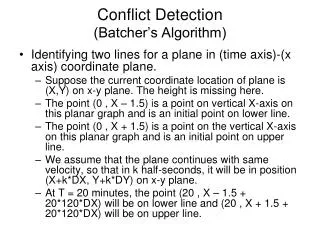
Unnecessary deviation • /EXPERIMENTAL TURBULENCE FI UAL███/AN N███UA UPLINK • -- 01 Jul 2006 22:08:10Z FL 360 orient. 88 deg • '+'=waypoint, '*'=route, 'X'=aircraft at 43.2N, 86.3W • ' '=no_data, 'o'=smooth, 'l'=light, 'M'=mod, 'S'=severe • ---------------------------(25 to EJOYS)------------------ • ll | * • lll | * • lll | * • lll | * • lll | * • lll | lllll* • lll l | ollll* • lll M | oolll*l • lll | llll * • lll +MONEE llllllll + • lll l | ll llllll * • lll l | llll lllllll*ll • lll l | oll lllllllll*ll • lll l | ool lllllllll * • lll | lllllll * • lll | llllll * • lll l | llllllll * • lll l | olllllllll * • lll l | ooo lllllll * • Mll | o lllllll * • lll | lllll * • lll | lloo * • lol | * • llo | * • llo | * • lll | * • lll l | ll * • lll l | lll * • lll l +GRUBB lll + • lll |040 ll * • ll | * • | * • | * • | * • | * • | * • | * • | * • | * • | * • | * • | * • | * • | * • | * • | * • | * • | * • | * • -------|---------valid----------X------------------------- • -90 +90|Left 40 2205Z (86 from BAE) Right 40 NTDA uplink message at 2208 UTC NTDA turbulence display at 2210 UTC Radar at ~2215 UTC (deviation began at 2213) View toward left at about 2215 UTC
Pilot Feedback • “The uplink messages I’ve received in the cockpit gave a very accurate picture of turbulence location and intensity. The turbulence level of detail is beyond what current onboard weather radars can detect. The depiction of turbulence intensity ahead provides an unprecedented and extremely valuable new tool for pilot situational awareness.” – Capt. Rocky Stone, Chief Technical Pilot for United Airlines • “In most of the instances of reports I have received there were radar returns that I was watching in the aircraft and was aware of the probability of turb. In this instance there were NO radar returns…. When the report printed I was rather surprised to see one. But the accuracy was right on for all four reports. At 2345Z we had about 30 sec of mod chop. Lt/mod chop started at 2346Z as noted on the 2343 report…. The noted "M" at 2354Z seemed right on. There was lightning well below us but no radar returns….” – United pilot
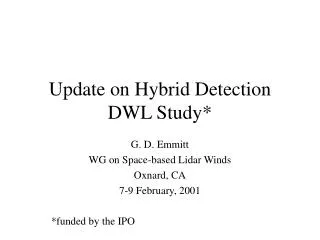
NTDA Demo: Comparison Methodology (2005) 3,000 ft 10 km (1 minute) Each aircraft measurement is compared with the median mosaic value over a rectangular volume around the flight segment.
NTDA Demo: Comparison Results (2005) smooth 5 June 2005 - 5 October 2005 comparisons for NTDA mosaic of 16 NEXRADs light moderate severe NTDA EDR vs. commercial aircraft 1-minute medianin situ EDR Corresponding ROC skill curves for EDR > 0.1, 0.3, 0.5 m2/3/s, resp.
NTDA Demo: Comparison Results (2005) extreme smooth 5 June 2005 - 5 October 2005 comparisons for NTDA mosaic of 16 NEXRADs light moderate severe NTDA EDR vs. commercial aircraft 1-minute peakin situ EDR Corresponding ROC skill curves for EDR > 0.1, 0.3, 0.5, 0.7 m2/3/s, resp.
NTDA demo: Comparison Methodology (2006) For each aircraft measurement and each radar sweep, the in situ EDR is compared with the median of all radar polar grid values within a rectangular volume around the flight segment. 3,000 ft 8 km (1 minute)
NTDA Demo: Comparison Results (2006) smooth 5 June 2005 - 5 October 2005 comparisons for NTDA mosaic of 24 NEXRADs (alt > 15,000 ft, conf > 0.1, pts. in volume > 12) light moderate severe NTDA EDR vs. commercial aircraft 1-minute medianin situ EDR Corresponding ROC skill curves for EDR > 0.1, 0.3, 0.5 m2/3/s, resp.
NTDA Demo: Comparison Results (2006) extreme smooth 8 June 2005 - 28 October 2006 comparisons for NTDA mosaic of 24 NEXRADs light moderate severe NTDA EDR vs. commercial aircraft 1-minute peakin situ EDR Corresponding ROC skill curves for EDR > 0.1, 0.3, 0.5, 0.7 m2/3/s, resp.
Why are the 2006 results worse? • NTDA data • Mosaic combines data from multiple tilts and multiple radars, providing more averaging • Confidence-weighted smoothing was used to form mosaic • In radar sweep comparisons, individual point confidences weren’t considered • Summer 2006 used NTDA “speckle” algorithm optimized for speed, not well tuned • Summer 2006 version of NTDA did not incorporate latest improvements resulting from case studies • EDR data • Values too quantized, and may not be well-calibrated • Relatively low temporal and spatial resolution • Uncertainty in times and locations • Comparison methodology • The 2006 comparison of high-resolution NTDA product to low-resolution EDR data may not be accurate • The 2005 mosaic provided greater NTDA smoothing, improving comparison results
Comparisons for distance < 0.5 km and time difference < 60 s In contrast: NASA B-757 comparisons (2003) NTDA EDR vs. aircraft EDR for all NASA flights(points colored by NTDA confidence) Corresponding ROC skill curves for EDR >0.15, >0.35, >0.55, >0.75 m2/3/s, resp.
Case studies • Many comparisons flagged as “bad” can be explained by examining overlay plots Reflectivity NTDA EDR • In this case, the aircraft appears to have been flying along the edge of the cloud
Case studies (2) • Some cases show that turbulence can be very localized, making comparison with 1-min in situ EDR difficult NTDA EDR, 2.4 NTDA EDR, 3.3 • In this case, the aircraft appears to be descending from a level of high turbulence to one with lower turbulence
Case studies (3) • Some cases were very useful for tuning NTDA EDR SNR • In this case, the NTDA appears not to be adequately reducing confidence in a region of low SNR
Recent algorithm changes • New SW confidence interest maps • Added ability to use VCP-dependent interest maps • E.g., power ratio map in VCP 121 • Modified reflectivity/height map • Added SW/Nyquist interest map • Fixed bug in coverage fraction interest map • Replaced 2-D linear fit with 1-D • New SW-to-EDR scaling function • Computed improved theoretical values • Experimenting with using 2-D (range and DZ) table to accommodate biased SW estimators, hydrometeor inertia effects • Parameter tuning continues
Implementation optimization • Software refactoring and optimization resulted in an approximately 80% reduction in execution time • Reduction in number of data levels and range resolution, and correction of implementationerror reduced product size by over 90% • 64 levels for EDR, 8 levels for confidence • Range resolution 2 km
Implementation optimization (2) • Case: KDIX_20060918_230713 - VCP32 - WX: none • Timing: 1.54 seconds/volume • Product: 4.02 kB/volume • Case: KMKX_20050915_160309 - VCP32 - WX: some on periphery • Timing: 2.14 seconds/volume • Product: 9.89 kB/volume • Case: KMKX_20050925_190334 - VCP21 - WX: about half coverage • Timing: 4.05 seconds/volume • Product: 48.06 kB/volume • Case: KMKX_20050605_070015 - VCP121 - WX: significant coverage • Timing: 4.69 seconds/volume • Product: 57.28 kB/volume • Case: KINX_20060429_025230 - VCP12 - WX: very substantial coverage • Timing: 7.91 seconds/volume • Product: 94.72 kB/volume
ORDA spectrum width data quality • Comprehensively examined 14 radar-days of data from April and May, 2006 • Observations • Ring “artifacts” observed in pre-ORDA VE and SW near end of unambiguous range were NOT found • Suspicious spectrum widths apparently caused by clutter filter were noted • However, the NTDA “speckle” interest map assigned these low confidence
ORDA: KHTX, 20060507, VCP 21 DZ VE SW SNR
ORDA spectrum width data quality (2) • Simulations suggest that strong-trip SZ-2 spectrum widths will saturate well below current level • NTDA ability to detect hazardous turbulence may be reduced • Alternative or hybrid SW estimator may be required • See report at www.rap.ucar.edu/staff/meymaris/awrt_fy06/ VCP 12, PRT 913 s, 43 pulses; weak-trip SNR 10 dB VCP 212, PRT 913 s, 64 pulses; weak-trip SNR 10 dB
Future NTDA research and development • Algorithm and parameter changes as needed to keep up with ORDA/ORPG upgrades • SZ-2, staggered PRT, dual-pol, etc. • Improve EDR estimates • VE data (e.g., structure functions) • Remove shear effect on spectrum widths • Adjust for hydrometeor inertial effects • Use other data (e.g., DZ variance, dual-pol data) • Improve quality control • Use dual-polarization data to identify non-atmospheric signals • Improve SW estimation techniques
NTDA future needs/wants • Improved spectrum widths • Greater than 0.5 m/s resolution! • Ability to trade SW resolution for accuracy (oversampling, spectral averaging) • ORDA/ORPG changes should not degrade SW • Polarimetric data for • Improved QC • PID for hydrometeor inertial effects adjustment • Additional turbulence diagnostic
Implementation schedule • November and December 2007 – comprehensive testing, tuning, documentation • January 2007 – second DAR, IRR • February 2007 – Deliver NTDA code to Radar Operations Center for inclusion in ORPG Build 10.0 • Spring 2008 – NTDA operational on all NEXRADs • Spring 2010 – GTG-N on Experimental ADDS, using mosaic of NTDA EDRs for in-cloud turbulence • Note: Agreement between the FAA and NWS for collecting and disseminating the data, presumably via AWIPS, remains to be established.
NEXRAD turbulence detection challenges • NEXRADs measure mostly horizontal wind fluctuations, but vertical have greatest effect on aircraft • Convectively-induced turbulence may not be well-developed and may not satisfy theoretical models • Ground-based scans are slow, have poor resolution at large distances (at 60 miles, 1 1 mile), and have large gaps between sweeps at high angles • Radar data are contaminated by non-atmospheric and measurement noise • Radar spectrum width not extensively tested/tuned • Turbulence is a statistical quantity—measurements must be averaged to be meaningful
NTDA funding sources • FAA AWRP Turbulence PDT • Algorithm development, tuning, and verification (Task 07.7.3.1.1) • Real-time demonstration (Task 07.7.3.1.2) • FAA AWRP Advanced Weather Radar Techniques PDT • ORPG/CODE implementation (Task 07.6.29) • Total FAA AWRP FY07 funding request $380k • Tri-agency NEXRAD Operations and Maintenance funding will be required for transfer • The Turbulence and AWRT PDT 7-year plans include proposed funding for continued NTDA research and development