Download
1 / 23
230 likes | 364 Views
International Financial Centres in the post-crash era. Vanessa Rossi, Senior Research Fellow, Chatham House. March 2009. Overview. The global recession and financial storm has not yet abated – a stress test of survival

E N D
International Financial Centres in the post-crash era Vanessa Rossi, Senior Research Fellow, Chatham House March 2009
Overview The global recession and financial storm has not yet abated – a stress test of survival The crisis has highlighted the massive increase in balance sheet risks compared with national incomes Iceland marked the end of the “small country-big bank” model of global finance Yet banks will become more important as financial intermediaries if saving deposits rise and retail investors shun risk: the “Tokyo scenario” 2
World trade smashed by storm • 2009 may be down 20-30% versus 2007 data – larger losses for Japan and the energy exporters Exports in US $ trillion: 2007 data versus 2009 estimates 3 Source: WTO
Investment trends: exodus from risk creates global asset imbalance High growth and inflation • The US: “The Anglo Saxon Model” • US financial wealth was $60-65trn, over 4x GDP • Under 15% of household wealth in bank deposits, as much as 50% in equities and corporate bonds • The EU: “Balanced Portfolio” • Total financial wealth similar to US • But household wealth held in equities lower Risk averse Risk taking • JAPAN: Cash • Wealth $30 trn • Nearly 55% of household wealth in bank deposits Low growth and inflation
Holdings of debt, equity and deposits 2008 – shaded areas represent estimated losses in equity values by March 2009
Wealth losses almost 1 year’s GDP - equities shrink, role of government rises WORLD FINANCIAL WEALTH TOTAL SHRINKS FROM $200 TO $160 trillion? GLOBAL TOXIC ASSETS $3-5trillion? BANK DEPOSITS and CASH around $70 trillion Larger than world GDP of $55 trillion TOTAL BONDS VALUE DOWN FROM $65 to $55 trillion Government share up from 50% to 60-65% Government debt up, corporate bonds fall EQUITIES - OTHER ASSETS VALUE FALLS From peak $65 to $35trillion?
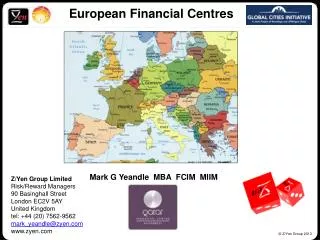
Implications: Big banks: few “global players”, a cluster in the US, China and Japan and, arguably, the Gulf region backed also by “oil deposits” Europe - cross-border issues? Other IFCs will have to focus heavily on financial services with low balance sheet exposure – stiff competition London may be the most affected of the major financial centres – this crisis is the banking equivalent of previous restructuring in reinsurance and Lloyds of London 7
Japan’s banks: expand assets abroad liabilities assets JAPANESE BANK DEPOSITS TOTAL $10 trillion Prudential reserves $0.2 trillion PRIVATE SECTOR LOANS $5 trillion LOANS TO GOVERNMENT $3 tn about 35% of Gov Debt FOREIGN ASSETS $2 tn LIABILITIES $1 tn
China’s banks: “cash” now mobilised liabilities assets CHINESE BANK DEPOSITS TOTAL $6.5-7.0 trillion Prudential reserves Over $1 trillion Policy easing PRIVATE SECTOR LOANS $5 trillion LOANS TO GOVERNMENT $0.5 tn about 100% of Gov Debt FOREIGN ASSETS $0.3 tn LIABILITIES $0.1 tn
Economic ranking by size of GDP – which countries are big enough? 10
Comparison of GDP and Stock Market Capitalizations as Shares of World
Shares of World GDP (%) (chart data at 1990 constant prices, own estimates) • China the only economy gaining share • It is the only sizeable contender of the BRICs • Stock market capitalisations will broadly follow these GDP trends
Japan’s shares in world economy and markets • Japan’s shares in world wealth and other market indicators much larger than share in global GDP
Japan is the 3rd largest bond market • Larger share in global bonds than equities: approx 15% versus only 8% share of world GDP and equities
Holding of JGBs by foreign investors trend up but still low, close to $0.5 trillion
Potential growth in foreign investment in Japanese markets • High estimate: bond holdings rise to match equity stakes • Low estimate: no increase in holdings except for modest increase in equity investments based on maintaining share of market
The Asian debt market should expand Critical to rebalance global asset demand and supply and to fund development in low savings countries such as India, Bangladesh, Vietnam Potential to grow dramatically - possibly $1trillion pa? Japan would be a key participant here e.g. Samurai bonds: “rare oasis” during credit crunch. Froze after Lehman collapse but reopened in February: $2.2bn (Westpac), $1.5bn (Indonesia) 17
The March 2009 City of London Survey: Tokyo and Sydney drop below top 10 19
Recommendations regarding the City of London Surveys • Two possibilities for consideration: • (1) The report may be more widely understood and accepted as a barometer of IFCs performance and strength if it were to adopt a two-pronged strategy and rankings: • Firstly comparing countries’ leading international financial centres (ex: London, New York, Tokyo) • Secondly comparing secondary (regional or niche) financial centres around the world (ex: Chicago, Geneva, Channel Islands) • This might help focus attention on the most critical factors in the international surveys and underlying changes in view. • (2) Greater methodological weight could be placed on the size and development of financial sectors rather than on “ease of access” type factors. We agree that it is important to preserve the nuances brought into the survey by the direct personal input of market participants and these are not an issue.
GFCI5 divided into international and secondary centres: more representative 21
THANK YOU www.chathamhouse.org.uk/internationaleconomics 23