Download
1 / 48
480 likes | 642 Views
Natural Areas Protection Strategies Alachua County, Florida. Alachua County Environmental Protection Dept. In 2006, Pinellas County became the first county in Fla. to reach 100% buildout - 2060 Report on the Future of Florida. Population Allocation. Landscapes in Conflict.

E N D
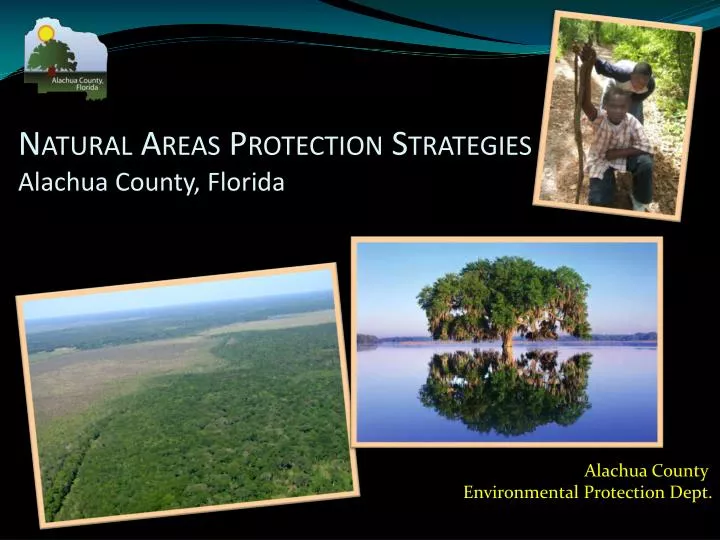
Natural Areas Protection StrategiesAlachua County, Florida Alachua County Environmental Protection Dept.
In 2006, Pinellas County became the first county in Fla. to reach 100% buildout - 2060 Report on the Future of Florida.
Population Allocation Landscapes in Conflict New Urban Landscapes Preferred Agriculture Landscapes Preferred Conservation Landscapes 2004 Population: 870,652 Urban Landscapes Protected Conservation Landscapes Protected Working Landscapes Major Roads Water Bodies
Population Allocation Landscapes in Conflict New Urban Landscapes Preferred Agriculture Landscapes Preferred Conservation Landscapes 2005 Population: 966,800 Urban Landscapes Protected Conservation Landscapes Protected Working Landscapes Major Roads Water Bodies
Population Allocation Landscapes in Conflict New Urban Landscapes Preferred Agriculture Landscapes Preferred Conservation Landscapes 2010 Population: 1,104,300 2009: 1,001,116 Census Urban Landscapes Protected Conservation Landscapes Protected Working Landscapes Major Roads Water Bodies
Population Allocation Landscapes in Conflict New Urban Landscapes Preferred Agriculture Landscapes Preferred Conservation Landscapes 2015 Population: 1,248,200 Urban Landscapes Protected Conservation Landscapes Protected Working Landscapes Major Roads Water Bodies Preferred Urban has been fully allocated. Now allocate people to the areas in conflict between Urban and other more appropriate uses.
Population Allocation Landscapes in Conflict New Urban Landscapes Preferred Agriculture Landscapes Preferred Conservation Landscapes 2020 Population: 1,398,700 Urban Landscapes Protected Conservation Landscapes Protected Working Landscapes Major Roads Water Bodies
Population Allocation Landscapes in Conflict New Urban Landscapes Preferred Agriculture Landscapes Preferred Conservation Landscapes 2025 Population: 1,556,200 Urban Landscapes Protected Conservation Landscapes Protected Working Landscapes Major Roads Water Bodies
Population Allocation Landscapes in Conflict New Urban Landscapes Preferred Agriculture Landscapes Preferred Conservation Landscapes 2030 Population: 1,717,600 Urban Landscapes Protected Conservation Landscapes Protected Working Landscapes Major Roads Water Bodies
Population Allocation Landscapes in Conflict New Urban Landscapes Preferred Agriculture Landscapes Preferred Conservation Landscapes 2035 Population: 1,867,760 Urban Landscapes Protected Conservation Landscapes Protected Working Landscapes Major Roads Water Bodies
Population Allocation Landscapes in Conflict New Urban Landscapes Preferred Agriculture Landscapes Preferred Conservation Landscapes 2040 Population: 2,017,920 Urban Landscapes Protected Conservation Landscapes Protected Working Landscapes Major Roads Water Bodies
Population Allocation Landscapes in Conflict New Urban Landscapes Preferred Agriculture Landscapes Preferred Conservation Landscapes 2045 Population: 2,168,080 Urban Landscapes Protected Conservation Landscapes Protected Working Landscapes Major Roads Water Bodies
Population Allocation Landscapes in Conflict New Urban Landscapes Preferred Agriculture Landscapes Preferred Conservation Landscapes 2050 Population: 2,318,240 Urban Landscapes Protected Conservation Landscapes Protected Working Landscapes Major Roads Water Bodies
Population Allocation Landscapes in Conflict New Urban Landscapes Preferred Agriculture Landscapes Preferred Conservation Landscapes 2055 Population: 2,468,400 Urban Landscapes Protected Conservation Landscapes Protected Working Landscapes Major Roads Water Bodies
Population Allocation Landscapes in Conflict New Urban Landscapes Preferred Agriculture Landscapes Preferred Conservation Landscapes 2060 Population: 2,618,560 Urban Landscapes Protected Conservation Landscapes Protected Working Landscapes Major Roads Water Bodies
Population Allocation Landscapes in Conflict New Urban Landscapes Preferred Agriculture Landscapes Preferred Conservation Landscapes 2065 Population: 2,768,720 Urban Landscapes Protected Conservation Landscapes Protected Working Landscapes Major Roads Water Bodies
Population Allocation Landscapes in Conflict New Urban Landscapes Preferred Agriculture Landscapes Preferred Conservation Landscapes 2070 Population: 2,918,880 Urban Landscapes Protected Conservation Landscapes Protected Working Landscapes Major Roads Water Bodies
Population Allocation Landscapes in Conflict New Urban Landscapes Preferred Agriculture Landscapes Preferred Conservation Landscapes 2075 Population: 3,069,040 Urban Landscapes Protected Conservation Landscapes Protected Working Landscapes Major Roads Water Bodies
Population Allocation Landscapes in Conflict New Urban Landscapes Preferred Agriculture Landscapes Preferred Conservation Landscapes 2080 Population: 3,219,200 Urban Landscapes Protected Conservation Landscapes Protected Working Landscapes Major Roads Water Bodies
Population Allocation Landscapes in Conflict New Urban Landscapes Preferred Agriculture Landscapes Preferred Conservation Landscapes 2085 Population: 3,369,360 Urban Landscapes Protected Conservation Landscapes Protected Working Landscapes Major Roads Water Bodies
Population Allocation Landscapes in Conflict New Urban Landscapes Preferred Agriculture Landscapes Preferred Conservation Landscapes 2090 Population: 3,519,520 Urban Landscapes Protected Conservation Landscapes Protected Working Landscapes Major Roads Water Bodies
Population Allocation Landscapes in Conflict New Urban Landscapes Preferred Agriculture Landscapes Preferred Conservation Landscapes 2094 Population: 3,631,792 Urban Landscapes Protected Conservation Landscapes Protected Working Landscapes Major Roads Water Bodies
Tragedy of the Commons Cows +1 Cost -0.2 Cows +1 Cost -0 Cows +1 Cost -0 Cows +1 Cost -0.2 Cows +2 Cost -0.4 Cows +1 Cost -0 Cows +1 Cost -0.2 Cows +1 Cost -0 Farmer Blue’s net is 1.6 related to the use of the common. The others’ are 0.8. This Triggers a race to add cows to the common further impacting the common and the cows Because the extra cow’s impact is now felt by all the 5 cows, each cow has 20% reduction In fitness (cost per cow = -0.2). Farmer Blue’s cost is -0.4 since he has two cows. After dark, Farmer Blue stealthily moves his cow onto the common. He has +2 Cows Four farms surround a common. The common has a max carrying capacity of 4 cows. So there is no impact to the cows’ Health (cost = 0). Times are good and the farmers buy a second cow for their farms. Each farmer has a cow (+1) which they agree can graze the common.
Cost of Unplanned GrowthHouses = Cows?Natural Areas = Commons? Property Taxes Cost of Services
Impact on Ecosystem Services • Gainesville Regional Utility provides 10 billion gallons annually. • To protect the source, GRU protected 7,000 acres of timber property. • Alachua County’s average groundwater recharge of 12 inches annually per acre or 2.3 billion gallons annually for the 7,000 acres • Only 23% of the need. • “Drinking Water Deficit”
Deficits and Sustainability The moral responsibility to pass on to future generations the opportunities for the same quality of life as we now enjoy and desire for ourselves.
Who is responsible? • “A society grows great when old men plant trees whose shade they know they shall never sit in.” Greek Proverb • “The World needs an enormous number of new Innovators, Change Agents, and Transformers, all dedicated to turning Development in the direction of sustainability. People like you.”Alan Atkisson • “The starting point for a better world is the belief that it is possible.” Norman Cousins • “There are no passengers on Spaceship Earth. We are all crew.” Marshall McCluhan • “The great use of life is to spend it for something that will outlast it.” Adlai Stevenson • “We do make a difference -- one way or the other. We are responsible for the impact of our lives. Whatever we do with whatever we have, we leave behind us a legacy for those who follow.” Stephen Covey • “Be the change you want to see in the world.”Gandhi Us!
Who is “Us”? Private Sector Public Sector Comp Plan TDRs Regulations Extractions Incentives Farms Forests Private Golf Courses Commercial Agriculture Land Acquisition Protected Natural Areas green space
Alachua County’s Natural Areas Protection Investment Strategy • Protect Natural Areas at all three scales: • Landscape (Land use planning, land acquisition), • Subdivision/parcel (land development codes), and • Individual/household (education & outreach) Lake Alto Preserve Madera Subdivision Outreach
Regulatory Framework • Local Code Enforcement responding to inappropriate uses on private property • County Comprehensive Plan and Land Development Code place a high value on natural areas • Promote Low Impact Development (LID) • Maintain urban boundary and protect rural character Future Land Use Map
Strategic Ecosystems Comp Plan Greenprints Critical Natural Systems. Why are corridors necessary?
Landscape Scale Land Development Standards • Require large natural buffers along all water features (wetlands, streams, floodways, lakes) • Require open space and connectivity between developments • Upland habitat protection standards • Protect trees and require minimum % of preserved canopy coverage • Identify and require strong protection standards for critical natural systems (i.e. strategic ecosystems) • Transfer of development rights (TDR) program • 100 year critical storm event capacity planning for stormwater • Landscaping with native vegetation
Landscape Scale Land Development Resource Protection Standards Flood Plain/Forest Protected Area Development Envelope Pasture DevelopmentArea
Parcel Scale Land Development Standards • Limit contamination sources (i.e. fertilizer) • Fertilizer and Irrigation Codes • Conserve vegetation, soils, and natural areas • Minimizedisturbance and soil compaction • Maintainhydrologic patterns • Minimize and disconnect impervious areas • Limit site runoff through design and LID practices
Individual Scale Education and Social Marketing • Work with developers to incorporate LID (“Green Streets”) • Recognition of private LID efforts • Outreachto K-12, college student and community population about protecting natural resources • Coordinate with University of Florida to create LID Manual and install pilot LID projects on campus
Regulatory Framework Outcomes * Areas identified as strategic ecosystems can have up to 50% of uplands protected.
NO! Is the Regulatory Framework Enough? • 1,800-acre development example • 1,900 homes planned • 1,200 acres of natural areas set aside • 1,200 acres = 1.1 million gallons of drinking water recharge/ day • At 423 gal/ household; enough for 2,600 households • The 1,900 new households • And700 current households . Retrofitting the deficit? • Remember the 1,200 acres was already serving 2,600 existing • households • The 600 acres to be developed was already serving an 1,300 existing households. • Traded unprotected greenspace serving 3,900 current households for protected natural area serving 2,600 households: a net loss in ecosystem services and an actual increase in the deficit. • Need to protect large areas to complement the regulatory process
Alachua County Forever Land Conservation Program (photo by Mac Stone)
Alachua County voters asked if • they wanted to: • Preserve lands to protect • drinking water • Protect endangered plants • and animals • Public access for • resource-based • recreation - 85% YES County-wide Survey - 1999 - 78% YES - 75% YES
Bonds totaling $29 million • 0.25 mill property tax for not more than 20 years • Offset by sunset of library capital millage of .2469 APPROVED 62.5% The Funding Source
Alachua County Forever Alachua County was the 21st County in Florida to have a land acquisition program.
Public Land Acquisition Outcomes • 18,987 acres protected through $85 million in purchases • 34% County share of total land purchase costs • 50% County share of total land management costs • 90% of acreage designated for public access as of December 16, 2010
Economic Value of Protected Natural Areas Proximity Effect of Open Space Added value per parcel
Alachua County Natural Areas Protection links • Comprehensive Plan http://growth-management.alachua.fl.us/comprehensive_planning/2001-2020_comprehensive_plan/index.php Land Development Regulations http://growth-management.alachua.fl.us/land_development_code/index.php • Natural Resources Protection http://www.alachuacounty.us/Depts/EPD/NaturalResources/Pages/NaturalResources.aspx • Land Conservation http://www.alachuacountyforever.us Stephen Hofstetter, Manager Natural Resources Program shofstetter@alachuacounty.us Phone 352-264-6811 • Ramesh Buch, Manager Land Conservation Program rpbuch@alachuacounty.us Phone 352-264-6804