Download
1 / 1
10 likes | 73 Views
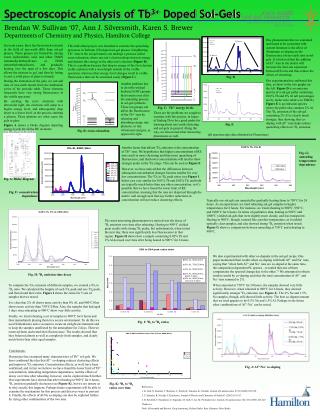
Investigation of rare-earth clustering and fluorescence quenching in Tb-doped sol-gel glasses, exploring the impact of aluminum co-doping and annealing temperatures on emission spectra. Discoveries on energy transfer phenomena and effects of Tb concentration variations.

E N D
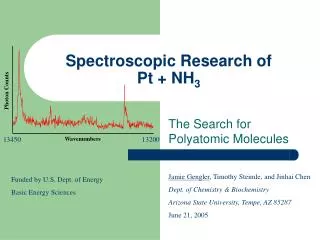
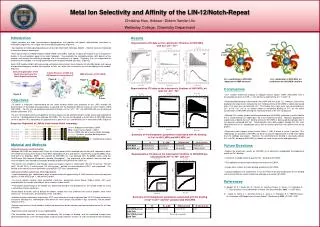
5D3 5D3 5D4 Energy (1000cm-1) 5D4 Energy (1000cm-1) 7F0 1 620nm 590nm 490nm 545nm 2 436nm 414nm 460nm 3 4 5 6 22 26 12 18 28 14 20 24 26 30 10 12 16 22 20 14 28 16 30 18 10 24 7F0 1 2 3 4 5 7F6 2 6 8 4 0 2 6 8 4 Brendan W. Sullivan ‘07, Ann J. Silversmith, Karen S. Brewer Departments of Chemistry and Physics, Hamilton College Spectroscopic Analysis of Tb3+ Doped Sol-Gels One phenomenon that we examined and found to be consistent with current literature is the effect of Aluminum co-doping on the fluorescence of rare-earth ions in sol-gels. It is believed that the addition of Al3+ ions to the matrix will increase the inter-ion separation between RE ions and thus reduce the effects of clustering. Our experimentation confirmed this idea, as show in the two graphs on the left. Figure D is an emission spectra of a sol-gel pellet containing 0.02% Tb and 0% Al (all percentages are by molar ratio relative to TMOS). Figure E is an emission spectra where the pellet also contains 2% Al. The 5D3 emission of the sol-gel containing 2% Al is clearly much stronger, thus showing that co-doping with Al3+ ions helps reduce quenching effects on 5D3 emission. This individual project was intended to examine the quenching processes in Terbium (Tb) doped sol-gel glasses. Neighboring Tb3+ ions in the sol-gel matrix can undergo a process called cross-relaxation, where one ion’s electron drops down in energy and donates this energy to the other ion’s electron (Figure B). This is a problem because that drop in energy of the first electron yields a photon with a wavelength outside of the visible spectrum, whereas other energy level changes result in visible fluorescence that can be examined easily (Figure C). Fig. D Another problem has to do with residual hydroxyl (OH-) groups that remain even after the annealing process in sol-gel synthesis. These ion groups can affect the fluorescence of the Tb3+ ions by releasing and absorbing energy into phonons, or tiny vibrational energies, as opposed to light. Fig. C: Tb3+ energy levels These are the problems we sought to examine with this project, in hopes of finding Tb to be a good probe for learning about rare-earth clustering and sol-gels in general. Along the way, we discovered other interesting phenomena as well. In recent years, there has been much research in the field of rare-earth (RE) dope sol-gel glasses. These glasses are formed by mixing water, hydrochloric acid, and either TMOS (tetramethylorthosilicate) or TEOS (tetraethylorthosilicate), and gradually heating over the span of a few days. This allows the mixture to gel, and then by letting it cool, a solid piece of glass is formed. During the formation of the gels, we can add ions of rare-earth metals from the lanthanide series of the periodic table. These elements frequently have very strong fluorescence in the visible spectrum. By exciting the ion’s electrons with ultraviolet light, the electrons will jump to a higher energy level, and subsequently drop down to a lower level, in the process emitting a photon. These photons are what cause the gels to glow. Figure A shows a Dieke diagram depicting energy levels for all the RE elements: Fig. E Fig. B: cross-relaxation (all spectroscopic data obtained on Fluoromax) Another factor that affects 5D3 emission is the concentration of Tb3+ ions. We hypothesize that higher concentrations of RE ions result in more clustering and thus more quenching of fluorescence, and that lower concentrations will tend to show stronger peaks in the 5D3 range. This can be seen in Figure F. However, we have noticed that the differences between subsequent concentration changes become smaller for very low concentrations. The 5D3 to 5D4 peak ratios (see Figure I below) are very similar for 0.01% Tb and 0.02% Tb, and both are typically much better than any other concentration, so it’s possible that we have found the lower limit of RE concentration, meaning that the ions are dispersed through the matrix well enough such that any further reductions in concentration will not reduce clustering effects. Fig. G: annealing temperature dependence Fig. A: Dieke diagram Fig. F: concentration dependence Typically our sol-gels are annealed by gradually heating them to 750°C for 24 hours. As an experiment, we tried reheating sol-gel samples to higher temperatures for 6 hours. For instance, we tried reheating to 900°C, 950°C, and 1000°C for 6 hours. In terms of qualitative data, heating to 950°C and 1000°C yielded sol-gels that were slightly more cloudy, and less transparent. Heating to 900°C, though, seemed like a perfect temperature, as it yielded optically clear samples, and also showed strong 5D3 emission when tested. Figure G shows a comparison between annealing at 750°C and reheating to 900°C. The most interesting phenomenon we noticed was the decay of 5D3 emission over time after reheating. Heating to 900°C yielded great results with strong 5D3 peaks, but unfortunately, when tested the next day, there was significantly less fluorescence in that region. Figure H shows how a sample containing 0.02% Tb and 2% Al decayed over time after being heated to 900°C for 6 hours. We also experimented with other co-dopants in the sol-gel recipe. One paper mentioned their results when co-doping with both Al3+ and Na+ ions, saying that “when both Al3+ and Na+ ions are co-doped at the same time, the composition dependent PL spectra…revealed that one of them compensates the spectral change due to the other.”1 We attempted to obtain similar results by co-doping such that the total concentration of Al3+ and Na+ ions summed to 2%. When annealed at 750°C for 24 hours, the samples showed very little activity. However, when reheated to 900°C for 6 hours, they showed significantly stronger 5D3 emission (see Figure J). The 2% Na and 1.5% Na samples, though, still showed little activity. The best co-dopant amount that we tried appears to be 0.5% Na and 1.5% Al. Perhaps in the future other combinations of Al3+/Na+ can be tested. Fig. H: 5D3 emission time decay To compare the 5D3 emission of different samples, we created a 5D3 to 5D4 ratio. We calculated the heights of each 5D3 peak and one 5D4 peak, and then found their ratio. Figure I shows the ratios for 5 sets of samples that we tested. It is clear that 2% Al shows more activity than 0% Al, and 900°C/6hrs shows more activity than 750°C/24hrs. Also, the samples that had aged 3 days since reheating to 900°C show very little activity. Finally, we tried reheating a set of samples to 900°C for 6 hours and then immediately placing them in a secure environment. To do this we used Schlenkware and a vacuum to create an airtight environment and to keep the samples unaffected by the atmosphere for 2 days. Then we removed them and tested their fluorescence. The results showed that they behaved almost as well as completely fresh samples, and clearly much better than other aged samples. Fig. I: 5D3 to 5D4 ratios Conclusions: Our project has examined many characteristics of Tb3+ sol-gels. We have confirmed the idea that Al3+ co-doping reduces clustering effects and improves 5D3 emission. Concentration effects, as well, have been confirmed, and in fact we believe we have found the lower limit of Tb3+ concentration. Annealing temperature dependence, and the effects of decay over time after reheating, however, can be explored much further. Our experiments have shown that after reheating to 900°C for 6 hours, 5D3 emission gradually decreases (see Figure K), but we are unsure as to why exactly this happens. Perhaps future experiments will be able to examine the mechanism for this process and discover ways to prevent it. Finally, the effects of Al/Na co-doping can also be explored further by trying other combinations of the two ions. Fig. J: Al3+/Na+ co-doping Fig. K: 5D3 to 5D4 ratios over time References: 1. K. Itoh, N. Kamata, T. Shimazu, C. Satoh, K. Tonooka, K. Yamada. Journal of Luminescence 87-89 (2000) 676-678. 2. T. Ishizaka, R. Nozaki, Y. Kurokawa. Journal of Physics and Chemistry of Solids 63 (2002) 613-617. 3. R. Reisfeld, T. Saraidarov, E. Ziganski, M. Gaft, S. Lis, M. Pietraskiewicz. Journal of Luminescence 102-103 (2003) 243-247. Thanks to: Profs. Silversmith and Brewer, Greg Armstrong, Helena Grabo, Kate Schirmer, Peter Burke