Download
1 / 38
390 likes | 666 Views
Forest Productivity Information from Soil Surveys. Steve Campbell USDA – Natural Resources Conservation Service Pacific Northwest Soil Survey Region Portland, Oregon. Sources of Soil Survey Forest Productivity Data. Published soil survey reports Web based soil survey information

E N D
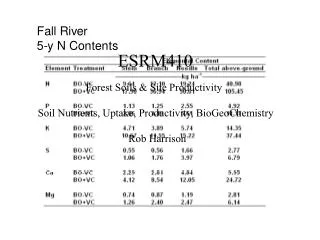
Forest Productivity Information from Soil Surveys Steve Campbell USDA – Natural Resources Conservation Service Pacific Northwest Soil Survey Region Portland, Oregon
Sources of Soil Survey Forest Productivity Data • Published soil survey reports • Web based soil survey information • Web Soil Survey • Soil Data Mart
Soil Survey Forest Productivity Data • Site index - A measure of the quality of a site based on the height of dominant and co-dominant trees at a specified age. • Volume growth rate – culmination of mean annual increment (CMAI) in cubic feet per acre per year. • Total volume at a specified age – cubic feet or board feet.
Types of soil survey map units • Consociations – consist of one major soil (component) • 18A - Bayside silty clay loam, 0 to 3 percent slopes • Complexes and associations – consist of two or more major soils (components) • 4F - Agness-Sixes-Goldbeach complex, 30 to 60 percent south slopes
Soil Survey Forest Productivity Data Standards • Productivity data are assigned by soil map unit component. • Data from a minimum of three plots per soil component are collected. • The site index standard deviation must be less than 10 feet. • Data on additional plots are collected if necessary until this standard deviation is reached.
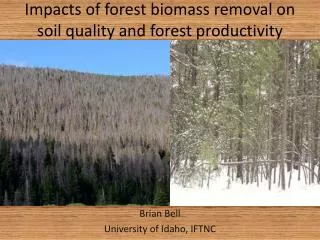
Forest Productivity Data from Published Soil Survey Reports vs. Web Based Data • The data in published soil surveys may not be the most current information. • The older a published soil survey report is, the more likely that the data is not current. • Web based data will provide the most current information.
Example - Forest Productivity Data from the Lane County, Oregon Soil Survey Report Map Unit Description: 35G-Cruiser gravelly clay loam, 50 to 70 percent slopes “This unit is suited to the production of Douglas-fir, noble fir, and western hemlock. On the basis of a 100 year site curve, the mean site index for Douglas-fir is 135. The potential production per acre is 8,280 cubic feet from an even-aged, fully stocked stand of trees 60 years old or 72,080 board feet (International rule, one-eighth-inch kerf) from an even-aged, fully stocked stand of trees 80 years old.”
Purpose of the Web Soil Survey • Provides electronic access to soil survey information. • Provides alternative to traditional hardcopy publication • Provides means for quicker delivery of information • Provides access to the current data
Click on the “Start WSS” button to get started. websoilsurvey.nrcs.usda.gov
The first step is create your “Area of Interest (AOI)”. Current selection criteria include Address; County; Soil Survey Area; Lat/Long; Section, Township and Range; and Hydrologic Unit
In this example “PLSS” is the selection criteria. Click on the “View” button to zoom into section 7, T 11 S, R 8 W.
We’re now zoomed in to the Area of Interest and the Orthophoto background appears
Clicking on the question mark brings up instructions for the map tools.
The scale can be calibrated for any monitor resolution by adjusting the length of a line segment to 1 inch.
When you zoom in, the orthophoto, roads, and water features appear. Layers can be turned on and off by clicking on the “Legend” tab.
When you have located the area where you want soils information, use the AOI buttons to create your “Area of Interest”. Either a rectangle or irregular shaped area can be created.
After you draw your “Area of Interest”, it will appear as a blue hatched area.
After the “AOI” is created, the size of the area and the type of data that is available is displayed. The next step is to click on the “Soil Map” tab.
Soil Map with Legend of Map Units, Acres, and Percent of Area
The soil map can be saved or printed. Clicking the “Printable Version” button creates a PDF file with the soil map, legend, and acres of map units in the area of interest.
Map Unit Legend with Acres and Percent of Area
Click on the “Soil Data Explorer” tab to create maps and reports of soil properties and interpretations, including forest productivity data.
Click on the Soil Reports tab to create reports of soil properties and qualities. The Forestland Productivity report is under the Vegetative Productivity category.
The “View Description” button will provide information on the content of the report. The “View Soil Report” button will produce the report.
Forest Productivity Report The “Volume of wood fiber” column is actually the culmination of mean annual increment (CMAI) in cubic feet per acre per year.
Forest Productivity Report in PDF format. The report can be printed directly or saved to your computer.
Maps and reports can also be created through the “Suitabilities and Limitations for Use” tab.
You select whether you want a map, table, or both. The user selects the tree species to display site index for. Under “Advanced Options”, a weighted average site index can be calculated. This is useful for mapunits that have more than one major soil.
Map and report of weighted average Douglas-fir site index. A PDF file of the map and report can be created by clicking the “Printable Version” button.
If you already have a soil map from a published soil survey, the Soil Data Mart web site can be used to quickly produce a Forest Productivity report. soildatamart.nrcs.usda.gov
After selecting State and County, click on the “Generate Reports” button and select the soil map units you want to include in the report.
Go to the drop-down list of reports and select “Forestland Productivity”, then click the “Generate Report” button.
Tabular and spatial data soil survey data can be downloaded by clicking on the “Download Data” button. This data can be used in Geographic Information System (GIS) software and MS Access to create maps and reports.