Download
1 / 50
510 likes | 776 Views
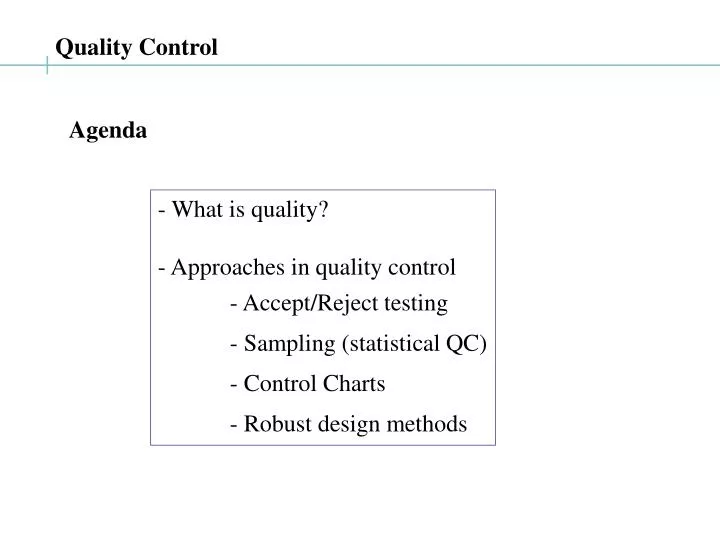
Quality Control. Agenda. - What is quality? - Approaches in quality control - Accept/Reject testing - Sampling (statistical QC) - Control Charts - Robust design methods. What is ‘Quality’. Performance :. - A product that ‘performs better’ than others at same function Example:

E N D
Quality Control Agenda - What is quality? - Approaches in quality control - Accept/Reject testing - Sampling (statistical QC) - Control Charts - Robust design methods
What is ‘Quality’ Performance: - A product that ‘performs better’ than others at same function Example: Sound quality of Apple iPod vs. iRiver… - Number of features, user interface Examples: Tri-Band mobile phone vs. Dual-Band mobile phone Notebook cursor control (IBM joystick vs. touchpad)
What is ‘Quality’ Reliability: - A product that needs frequent repair has ‘poor quality’ Example: Consumer Reports surveyed the owners of > 1 million vehicles. To calculate predicted reliability for 2006 model-year vehicles, the magazine averaged overall reliability scores for the last three model years (two years for newer models) Best predicted reliability:Sporty cars/Convertibles Coupes Honda S2000 Mazda MX-5 Miata (2005) Lexus SC430 Chevrolet Monte Carlo (2005)
What is ‘Quality’ Durability: - A product that has longer expected service life Nike Air Resolve Plus Mid Men’s Shoe (no warranty) Adidas Barricade 3 Men's Shoe (6-Month outsole warranty)
What is ‘Quality’ Aesthetics: - A product that is ‘better looking’ or ‘more appealing’ Examples? ? or
Defining quality for producers.. Example: [Montgomery] - Real case study performed in ~1980 for a US car manufacturer - Two suppliers of transmissions (gear-box) for same car model Supplier 1: Japanese; Supplier 2: USA - USA transmissions has 4x service/repair costs than Japan transmissions Lower variability Lower failure rate Distribution of critical dimensions from transmissions
Definitions Quality is inversely proportional to variability Quality improvement is the reduction in variability of products/services. How to reduce in variability of products/services ?
QC Approaches (1) Accept/Reject testing (2) Sampling (statistical QC) (3) Statistical Process Control [Shewhart] (4) Robust design methods (Design Of Experiments) [Taguchi]
Accept/Reject testing - Find the ‘characteristic’ that defines quality - Find a reliable, accurate method to measure it - Measure each item - All items outside the acceptance limits are scrapped Lower Specified Limit Upper Specified Limit target Measured characteristic
Problem with Accept/Reject testing (1) May not be possible to measure all data Examples: Performance of Air-conditioning system, measure temperature of room Pressure in soda can at 10° (2) May be too expensive to measure each sample Examples: Service time for customers at McDonalds Defective surface on small metal screw-heads
Problems with Accept/Reject testing Solution: only measure a subset of all samples This approach is called: Statistical Quality Control What is statistics?
The standard deviation =s= =√( s2) ≈ 0.927. Background: Statistics Average value (mean) and spread (standard deviation) Given a list of n numbers, e.g.: 19, 21, 18, 20, 20, 21, 20, 20. Mean = m =S ai / n = (19+21+18+20+20+21+20+20) / 8 = 19.875 The variance s2 = ≈ 0.8594
Background: Statistics.. Example. Air-conditioning system cools the living room and bedroom to 20; Suppose now I want to know the average temperature in a room: - Measure the temperature at 5 different locations in each room. Living Room: 18, 19, 20, 21, 22. Bedroom: 19, 20, 20, 20, 19. What is the average temperature in the living room? m =Sai / n = (18+19+20+21+22) / 5 = 20. BUT: is m = m ?
Background: Statistics... Example (continued) m =Sai / n = (18+19+20+21+22) / 5 = 20. BUT: is m = m ? If: sample points are selected randomly, thermometer is accurate, … then m is an unbiased estimator of m. - take many samples of 5 data points, - the mean of the set of m-values will approach m - how good is the estimate?
≈ 1.4142 sn= The unbiased estimator of stdevof a sample = s = Background: Statistics.... Example. Air-conditioning system cools the living room and bedroom to 20; Suppose now I want to know the variation of temperature in a room: - Measure the temperature at 5 different locations in each room. Living Room: 18, 19, 20, 21, 22. BUT: is sn = s? No!
Sampling: Example Soda can production: Design spec: pressure of a sealed can 50PSI at 10C Testing: sample few randomly selected cans each hour Questions: How many should we test? Which cans should we select? To Answer: We need to know the distribution of pressure among all cans Problem: How can we know the distribution of pressure among all cans?
Sampling: Example.. How can we know the distribution of pressure among all cans? Plot a histogram showing %-cans with pressure in different ranges
30 40 35 45 55 70 60 65 50 pressure (psi) Sampling: Example… Limit (as histogram step-size) 0: probability density function why? pdf is (almost) the familiar bell-shaped Gaussian curve! True Gaussian curve: [-∞ , ∞]; pressure: [0, 95psi]
Why is everything normal? pdf of many natural random variables ~ normal distribution WHY ? Central Limit Theorem Let X random variable, any pdf, mean, m, and variance, s2 Let Sn = sum of n randomly selected values of X; As n ∞ Sn approaches normal distribution with mean = nm, and variance = ns2.
-1, with probability 1/3 0, with probability 1/3 1, with probability 1/3 p(S1) X1 = S1 1 0 -1 -2, with probability 1/9 -1, with probability 2/9 0, with probability 3/9 1, with probability 2/9 2, with probability 1/9 X1 X2 X1 + X2 -1 -1 -2 -1 0 -1 -1 1 0 0 -1 -1 0 0 0 0 1 1 1 -1 0 1 0 1 1 1 2 X1 + X2 = p(S2) S2 1 2 0 -2 -1 -3, with probability 1/27 -2, with probability 3/27 -1, with probability 6/27 0, with probability 7/27 1, with probability 6/27 2, with probability 3/27 3, with probability 1/27 Gaussian curve Curve joining p(S3) X1 + X2 + X3 = p(S3) 3 1 2 S3 0 -2 -1 -3 Central limit theorem.. Example
(Weaker) Central Limit Theorem... Let Sn = X1 + X2 + … + Xn Different pdf, same m and s normalized Sn is ~ normally distributed Another Weak CLT: Under some constraints, even if Xi are from different pdf’s, with different m and s, the normalized sum is nearly normal!
Central Limit Therem.... Observation: For many physical processes/objects variation is f( many independent factors) effect of each individual factor is relatively small Observation + CLT The variation of parameter(s) measuring the physical phenomenon will follow Gaussian pdf
Sampling for QC Soda Can Problem, recalled: How can we know the distribution of pressure among all cans? Answer: We can assume it is normally distributed Problem: But what is the m, s ? Answer: We will estimate these values Samples
Background: Scaling of Normal Distribution If x is N(m, s), then z = (x – m)/s is N( 0, 1) Standard Normal distribution tables
Normal Distribution scaling: example A manufacturer of long life milk estimates that the life of a carton of milk (i.e. before it goes bad) is normally distributed with a mean = 150 days, with a stdev = 14 days. What fraction of milk cartons would be expected to still be ok after 180 days? Z = 180 days (Z - m)/s = (180 - 150)/14 ≈ 2.14 Use tables: Z = 2.14 area = 0.9838 Fraction of milk cartons that are ok Z ≥ 180 days or Z = m + 2.14s, is 1 - 0.9838 = 0.0162
Samples taken from a Normally Distributed Variable Central Limit Theorem Let X random variable, any pdf, mean, m, and variance, s2 Let Sn = sum of n randomly selected values of X; As n ∞ Sn approaches normal distribution with mean = nm, and variance = ns2. + Scaling Mean of the sample, mestimates mean of distribution Stdev of sample = s /√n. Estimates reliability of m as an estimate of m Standard error
Example: QC for raw materials A logistics company buys Shell-C brand diesel for its trucks. Full tank of fuel average truck travel ~ 510 Km, stdev 31 Km. New seller provides a cheaper fuel, Caltex-B, Claim that it will give similar mileage as the Shell-C. (i) What is the probability that the mean distance traveled over 40 full-tank journeys of Shell-C is between 500 Km and 520 Km? (ii) Mean distance covered by 40 full-tank journeys using Caltex-B ~ 495 Km. What is the probability that Caltex-B is equivalent to Shell-C?
Example: QC for raw materials.. (i) Shell-C: Full tank of fuel m ~ 510 Km, s ~ 31 Km. P( mean distance)40 is in [500 Km, 520 Km] ? Mean distance ≈ N( 510, s/√40 ) = N( 510, 31/√40 ) ≈ N( 510, 4.9) Use tables, Area between: z= (500 -510)/4.9 ≈ -2.04 and z = (520 - 510)/4.9 ≈ 2.04 Area = 1 - (( 1 - 0.9793) + (1 - 0.9793)) = 0.9586 P( mean distance)40 [500 Km, 520 Km] = 95.86%
Example: QC for raw materials... (ii) Shell-C: Full tank of fuel m ~ 510 Km, s ~ 31 Km. Mean distance covered by 40 full-tank journeys using Caltex-B ~ 495 Km. What is the probability that Caltex-B is equivalent to Shell-C? P(mean distance over 40 journeys) ≤ 495 ? m= 495 z = (495 - 510)/4.9 ≈ -3.06 P( m40 using Shell-C or similar ≥ 495) = 0.9989 P(Caltex-B is equivalent to Shell-C) = (1 - 0.9989) = 0.0011 This method of reasoning is related to Hypothesis Testing
Summary/Comments on Sampling - Statistics provides basis for reasoning; - Sampling is economical and more efficient than accept/reject - We may not know the population m and/or s more complex reasoning (not covered in this course)
Control Charts in QC 1. Use sampling of product/process 2. Repeat sampling at regular intervals 3. Plot the time series data 4. Look for any ‘patterns’ that may indicate ‘out-of-control’ process 4.1. Look for problem 4.2. Solve problem bring process back to ‘under-control’
Measure random sample of 5 rings in each hour Record mean value of the inside diameter Plot Process Control Charts: example Piston rings manufacturing Critical dimension: inside diameter Mfg process designed for: mean diameter = 74mm, s = 0.01 mm
Process Control Charts example: X-bar charts Mfg process designed for: mean diameter = 74mm, s = 0.01 mm [source: Montgomery]
is normally distributed with s = 0.01/√5 = 0.0045 m lies in acceptance interval m lies in the rejection interval No error Type II error Accept the claim Type I error No error Reject the claim X-bar charts – UCL and LCL s = 0.01, and n = 5; Process is in-control We should avoid a “False rejection” a = P( Type I error)
m lies in acceptance interval m lies in the rejection interval No error Type II error Accept the claim is N( 74, 0.0045) Type I error No error Reject the claim X-bar charts – UCL and LCL.. Process is in-control We should avoid a “False rejection” If we never reject the claim never commit Type I error 100(1 - a)% of the sample m must lie in [ 74 - Za/2(0.0045), 74 + Za/2(0.0045)] a = P( Type I error) Typical: P( Type I error) < 0.0027 Za/2 = 3
X-bar charts – UCL and LCL... Avoid “False rejection” P( Type I error) < 0.0027 Za/2 = 3 3-sigma control limits Piston Rings: Control limits = 74 ± 3(0.0045) UCL = 74.0135, LCL = 73.9865 [source: Montgomery]
X-bar charts: relationship between sample and x-bar [source: Montgomery]
Points of interest -- larger sample size control limit lines move close together -- Larger sample size control chart can identify smaller shifts in the process -- ±2s warning lines [source: Montgomery+]
Process Control Charts… - Great practical use in factories - First introduced by Walter A. Shewhart - Help to reduce variability - Monitor performance over time - Trends and out-of-control are immediately detected - Other common control charts: Range-charts (R-charts), …
Robust Design and Taguchi Methods Example: The INA Tile Company - Tiles made in Kiln - Variability in size too high - Variation due to baking process - Accept/Reject is expensive!
Ina Tile Example.. Cause: Different temperature profile in different regions SPC approach: Eliminate cause redesign Kiln
Ina Tile Example... Cause: Different temperature profile in different regions SPC approach: Eliminate cause reduce Temp variation How ? redesign Kiln Expensive!
Ina Tile example: Taguchi Method Response: Tile dimension Control Parameters (tile design): Amount of Limestone Fineness of additive Amount of Agalmatolite Type of Agalmatolite Raw material Charging Quantity Amount of Waste Return Amount of Feldspar Noise parameter was the temperature gradient. Taguchi: Experiment with different values of Control Parameters!
Ina Tile example: Taguchi Method.. Experiment with different values of Control Parameters Higher Limestone content desensitize design to noise
Robust Design definition A method of designing a process or product aimed at reducing the variability (deviations from target performance) by lowering sensitivity to noise. HOW ?
Typical Objectives of DOE (i) Determine which input variables have the most influence on the output; (ii) Determine what value of xi’s will lead us closest to our desired value of y; (iii) Determine where to set the most influential xi’s so as to reduce the variability of y; (iv) Determine where to set the most influential xi’s such that the effects of the uncontrollable variables (zi’s) are minimized. Tool used: ANalysis Of VAriance ANOVA
Concluding Remarks Statistical Tools are critical to QC QC is critical to all productive activities next topic: review for exam!