Download
1 / 26
260 likes | 378 Views
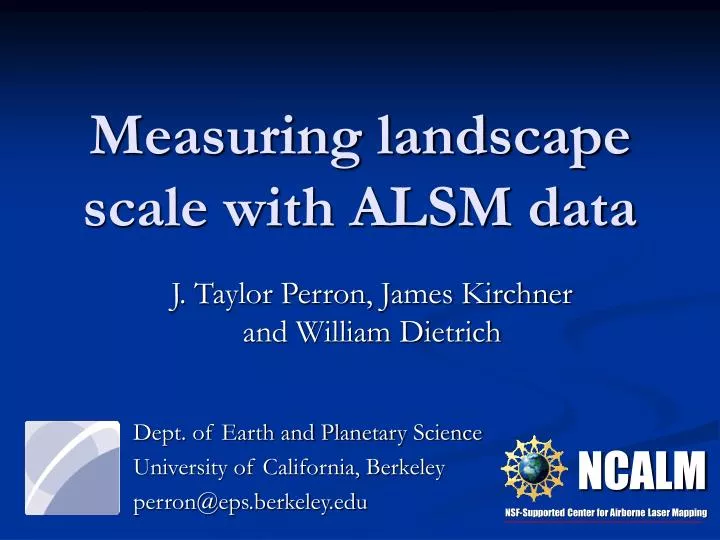
Dept. of Earth and Planetary Science University of California, Berkeley perron@eps.berkeley.edu. Measuring landscape scale with ALSM data. J. Taylor Perron, James Kirchner and William Dietrich. NCALM. NSF-Supported Center for Airborne Laser Mapping. Problem.

E N D
Dept. of Earth and Planetary Science University of California, Berkeley perron@eps.berkeley.edu Measuring landscape scale with ALSM data J. Taylor Perron, James Kirchner and William Dietrich NCALM NSF-Supported Center for Airborne Laser Mapping
Problem • Landscapes are often strongly periodic at multiple scales • Explaining this phenomenon requires that we quantify it 200m Gabilan Mesa, Salinas Valley, CA Zabriskie Point, Death Valley 5m
Applications (Why measure scale?) • Extract features of interest • Model testing ?
2-D Fourier transforms PSD (m4) Frequency (1/m)
~175m ~500m 4 km 2 km ALSM data: Gabilan Mesa, CA Acquired & processed in collaboration with NCALM staff at U. Florida
~500m ~175m Collapsed power spectrum
Landscape is smooth Collapsed power spectrum
99% Significance Level Testing significance
99% Significance Level Testing significance
Wavelength: 174 ± 13 m Orientation: 47° Significance level: 99.7% Wavelength: 480 ± 166 m Orientation: 141° Significance level: >> 99% Normalizing 2D spectra
Local Relief Application: Filtering by scale
Wavelength: 200 ± 11 m Orientation: 171° Significance level: 91% Wavelength: 480 ± 30 m Orientation: 90° Significance level: >> 99% Application 2: Model testing
Conclusions • 2D spectral analysis is an objective means of identifying & analyzing periodic topographic features • ALSM provides spectral resolution & accuracy necessary to identify limit of landscape dissection
Conclusions Applications: • Model testing • Filtering by scale, orientation, periodicity • Storage of large topographic datasets 100% of spectrum 7% of spectrum