Download
1 / 1
10 likes | 85 Views
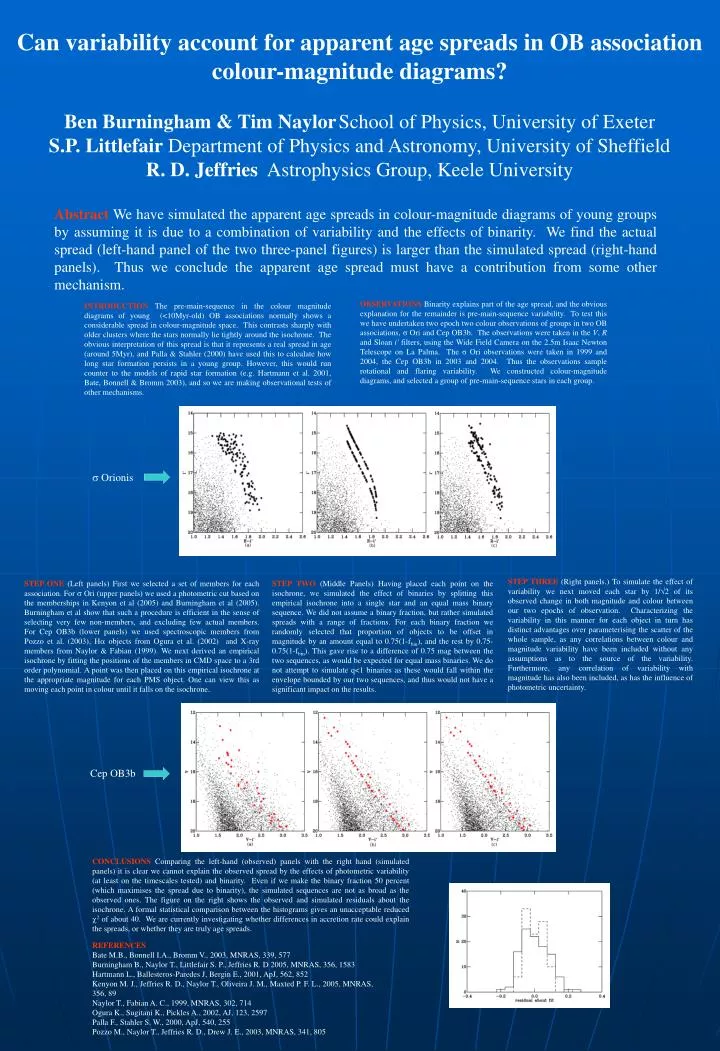
Can variability account for apparent age spreads in OB association colour-magnitude diagrams?. Ben Burningham & Tim Naylor School of Physics, University of Exeter S.P. Littlefair Department of Physics and Astronomy, University of Sheffield R. D. Jeffries Astrophysics Group, Keele University.

E N D
Can variability account for apparent age spreads in OB association colour-magnitude diagrams? Ben Burningham & Tim NaylorSchool of Physics, University of Exeter S.P. Littlefair Department of Physics and Astronomy, University of Sheffield R.D. Jeffries Astrophysics Group, Keele University Abstract We have simulated the apparent age spreads in colour-magnitude diagrams of young groups by assuming it is due to a combination of variability and the effects of binarity. We find the actual spread (left-hand panel of the two three-panel figures) is larger than the simulated spread (right-hand panels). Thus we conclude the apparent age spread must have a contribution from some other mechanism. OBSERVATIONS Binarity explains part of the age spread, and the obvious explanation for the remainder is pre-main-sequence variability. To test this we have undertaken two epoch two colour observations of groups in two OB associations, σ Ori and Cep OB3b. The observations were taken in the V, R and Sloan i' filters, using the Wide Field Camera on the 2.5m Isaac Newton Telescope on La Palma. The σ Ori observations were taken in 1999 and 2004, the Cep OB3b in 2003 and 2004. Thus the observations sample rotational and flaring variability. We constructed colour-magnitude diagrams, and selected a group of pre-main-sequence stars in each group. INTRODUCTION The pre-main-sequence in the colour magnitude diagrams of young (<10Myr-old) OB associations normally shows a considerable spread in colour-magnitude space. This contrasts sharply with older clusters where the stars normally lie tightly around the isochrone. The obvious interpretation of this spread is that it represents a real spread in age (around 5Myr), and Palla & Stahler (2000) have used this to calculate how long star formation persists in a young group. However, this would run counter to the models of rapid star formation (e.g. Hartmann et al. 2001, Bate, Bonnell & Bromm 2003), and so we are making observational tests of other mechanisms. Orionis STEP THREE (Right panels.) To simulate the effect of variability we next moved each star by 1/2 of its observed change in both magnitude and colour between our two epochs of observation. Characterizing the variability in this manner for each object in turn has distinct advantages over parameterising the scatter of the whole sample, as any correlations between colour and magnitude variability have been included without any assumptions as to the source of the variability. Furthermore, any correlation of variability with magnitude has also been included, as has the influence of photometric uncertainty. STEP ONE (Left panels) First we selected a set of members for each association. For Ori (upper panels) we used a photometric cut based on the memberships in Kenyon et al (2005) and Burningham et al (2005). Burningham et al show that such a procedure is efficient in the sense of selecting very few non-members, and excluding few actual members. For Cep OB3b (lower panels) we used spectroscopic members from Pozzo et al. (2003), Hobjects from Ogura et al. (2002) and X-ray members from Naylor & Fabian (1999). We next derived an empirical isochrone by fitting the positions of the members in CMD space to a 3rd order polynomial. A point was then placed on this empirical isochrone at the appropriate magnitude for each PMS object. One can view this as moving each point in colour until it falls on the isochrone. STEP TWO (Middle Panels) Having placed each point on the isochrone, we simulated the effect of binaries by splitting this empirical isochrone into a single star and an equal mass binary sequence. We did not assume a binary fraction, but rather simulated spreads with a range of fractions. For each binary fraction we randomly selected that proportion of objects to be offset in magnitude by an amount equal to 0.75(1-fbin), and the rest by 0.75-0.75(1-fbin). This gave rise to a difference of 0.75 mag between the two sequences, as would be expected for equal mass binaries. We do not attempt to simulate q<1 binaries as these would fall within the envelope bounded by our two sequences, and thus would not have a significant impact on the results. Cep OB3b CONCLUSIONS Comparing the left-hand (observed) panels with the right hand (simulated panels) it is clear we cannot explain the observed spread by the effects of photometric variability (at least on the timescales tested) and binarity. Even if we make the binary fraction 50 percent (which maximises the spread due to binarity), the simulated sequences are not as broad as the observed ones. The figure on the right shows the observed and simulated residuals about the isochrone. A formal statistical comparison between the histograms gives an unacceptable reduced 2 of about 40. We are currently investigating whether differences in accretion rate could explain the spreads, or whether they are truly age spreads. REFERENCES Bate M.B., Bonnell I.A., Bromm V., 2003, MNRAS, 339, 577 Burningham B., Naylor T., Littlefair S. P., Jeffries R. D 2005, MNRAS, 356, 1583 Hartmann L., Ballesteros-Paredes J, Bergin E., 2001, ApJ, 562, 852 Kenyon M. J., Jeffries R. D., Naylor T., Oliveira J. M., Maxted P. F. L., 2005, MNRAS, 356, 89 Naylor T., Fabian A. C., 1999, MNRAS, 302, 714 Ogura K., Sugitani K., Pickles A., 2002, AJ, 123, 2597 Palla F., Stahler S. W., 2000, ApJ, 540, 255 Pozzo M., Naylor T., Jeffries R. D., Drew J. E., 2003, MNRAS, 341, 805