Download
1 / 30
300 likes | 408 Views
Qualitative Modeling and Simulation of Genetic Regulatory Networks. Hans Geiselmann 1 and Hidde de Jong 2 1 Université Joseph Fourier, Grenoble 2 INRIA Rhône-Alpes Hans.Geiselmann@ujf-grenoble.fr Hidde.de-Jong@inrialpes.fr. Overview. 1. Introduction

E N D
Qualitative Modeling and Simulation of Genetic Regulatory Networks Hans Geiselmann1 and Hidde de Jong2 1Université Joseph Fourier, Grenoble 2INRIA Rhône-Alpes Hans.Geiselmann@ujf-grenoble.fr Hidde.de-Jong@inrialpes.fr
Overview 1. Introduction 2. Initiation of sporulation in Bacillus subtilis 3. Modeling and simulation of genetic regulatory networks 4. Stress adaptation in Escherichia coli 5. Conclusions and work in progress
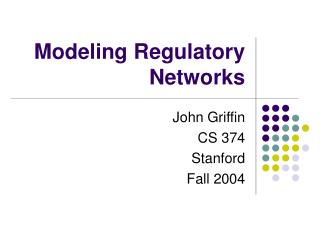
sporulation-germination cycle division cycle ? metabolic and environmental signals Life cycle of Bacillus subtilis • B. subtilis can sporulate when the environmental conditions become unfavorable
AbrB SinR~SinI Spo0A~P activates sin operon SinR A H SinI - AbrB represses sin operon SinI inactivates SinR sinI sinR + Spo0A˜P sin operon Regulatory interactions • Different types of interactions between genes, proteins, and small molecules are involved in the regulation of sporulation in B. subtilis • Quantitative information on kinetic parameters and molecular concentrations is usually not available
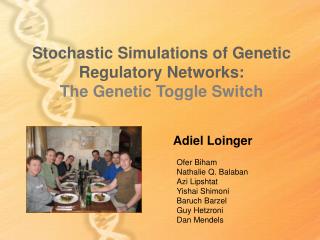
SinR/SinI SinR - SinI spo0A - protein Spo0A Signal gene + H H A H A A A H F A A H A sinR sinI + + - promoter + - + phospho- relay + kinA spo0E - KinA Spo0A˜P - - Spo0E sigF AbrB - Hpr abrB - - - + sigH (spo0H) hpr (scoR) Genetic regulatory network of B. subtilis • Reasonably complete geneticregulatory network controlling the initiation of sporulation in B. subtilis • Genetic regulatory network is large and complex
Qualitative modeling and simulation • Computer support indispensable for dynamical analysis of genetic regulatory networks: modeling and simulation • precise and unambiguous description of network • systematic derivation of behavior predictions • Method for qualitative simulation of large and complex genetic regulatory networks • Method exploits related work in a variety of domains: • mathematical and theoretical biology • qualitative reasoning about physical systems • analysis of hybrid systems • Method supported by computer tool GNA
A B x : protein concentration . . xaas-(xa, a2) s-(xb, b1 ) – axa xbbs-(xa, a1) s-(xb, b2 ) – bxb : threshold concentration - - - - , : rate constants b a PL models of genetic regulatory networks • Genetic networks modeled by class of differential equations using step functions to describe regulatory interactions • Differential equation models of regulatory networks are piecewise-linear (PL)
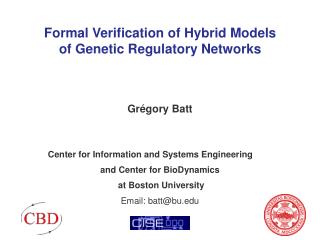
maxb . . xb b2 . . b1 0 maxa a1 a2 xa Domains in phase space • Phase space divided into domains by threshold planes • Different types of domains: regulatory and switching domains Switching domains located on threshold plane(s)
model in D3 : . . xaa– axa xaa– axa . . xbb – bxb xb – bxb model in D1 : (D1) (D1) {(a /a, b /b)} (D3) {(a /a, 0)} D3 (D3) D1 . . xaas-(xa, a2) s-(xb, b1 ) – axa xbbs-(xa, a1) s-(xb, b2 ) – bxb Analysis in regulatory domains • In every regulatory domain D, system monotonically tends towards target equilibrium set (D) maxb xb b2 b1 0 maxa a1 a2 xa
xb xb (D1) D3 D4 D5 D2 D1 D3 (D5) 0 (D3) (D4) 0 (D3) xa xa Analysis in switching domains • In every switching domain D, system either instantaneously traverses D, or tends towards target equilibrium set (D) Dand (D) located in same threshold hyperplane • Filippov generalization of PL differential equations
(D1) maxb b2 D3 D2 b1 D1 QS3 QS1 QS2 0 a2 a1 maxa Qualitative state and state transition • Qualitative state consists of domain D and relative position of target equilibrium set(D) QS1 D1,{(1,1)} • Transitionbetween qualitative states associated with D and D', if trajectory starting in D reaches D'
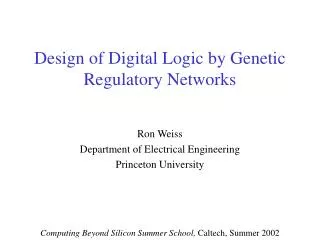
QS25 QS23 QS24 QS22 QS21 QS17 QS18 maxb QS16 QS20 QS19 D24 D22 D23 D25 D21 QS12 QS14 b2 D18 D19 D17 D20 D16 QS15 QS11 QS13 D15 D14 D13 D12 D11 QS7 QS6 QS8 D10 D9 D8 D6 D7 b1 QS10 QS9 D5 D4 D3 D2 D1 0 QS5 QS4 QS2 a6 QS3 a1 QS1 maxa State transition graph • Closure of qualitative states and transitions between qualitative states results in state transition graph Transition graph contains qualitative equilibrium states and/or cycles
Ordering of threshold concentrations of proteins 0 < a1<a2<maxa 0 < b1<b2<maxb • Ordering of target equilibrium values w.r.t. threshold concentrations a2<ka / ga<maxa b2<kb / gb<maxb maxb maxb kb /gb b2 b2 b1 b1 xb xb maxa 0 0 maxa a1 a1 a2 a2 a /ga xa xa Qualitative PL model • No exact numerical values for parameters , ,and ,but two types of inequality constraints:
maxb b2 b1 0 a6 a1 maxa D1 QS1 Qualitative simulation • All quantitative PL models subsumed by qualitative PL model have same state transition graph State transition graph derived from qualitative constraints on parameters • Qualitative simulation determines all qualitative states that are reachable from initial state through successive transitions
Genetic Network Analyzer (GNA) • Qualitative simulation method implemented in Java 1.3: Genetic Network Analyzer (GNA) Graphical interface to control simulation and analyze results
SinR/SinI SinR - SinI spo0A - Spo0A H H A H A A A H A F H A A Signal + sinR sinI + + - + - + phospho- relay spo0E + kinA - KinA Spo0A˜P - - Spo0E sigF AbrB - Hpr abrB - - - + sigH (spo0H) hpr (scoR) Simulation of sporulation in B. subtilis • Simulation method applied to analysis of regulatory network controlling the initiation of sporulation in B. subtilis
Model of sporulation network • Essential part of sporulation network has been modeled by qualitative PL model: 11 differential equations, with 59 parameter inequalities • Most interactions incorporated in model have been characterized on genetic and/or molecular level • With few exceptions, parameter inequalities are uniquely determined by biological data If several alternative inequalities are consistent with biological data, every alternative considered
division state initial state Simulation of sporulation network • Simulation of network under under various physiological conditions and genetic backgrounds gives results consistent with observations Sequences of states in transition graphs correspond to sporulation (spo+) or division (spo –) phenotypes 82 states
division state initial state maxka ka3 KinA ka1 s2 s3 s1 s5 s6 s4 s8 s9 s12 s10 s7 s13 s11 maxse Spo0E s7 s8 s9 s6 se3 s5 s11 se1 division state s4 s10 s2 s3 s1 s5 s6 s4 s8 s9 s12 s10 s7 s13 s11 s3 maxab s12 initial state AbrB s13 ab1 s2 s3 s1 s5 s6 s4 s8 s9 s12 s10 s7 s13 s1 s11 s2 Simulation of sporulation network • Behavior can be studied in detail by looking at transitions between qualitative states Predicted qualitative temporal evolution of protein concentrations
maxka maxka ka3 ka3 KinA KinA ka1 ka1 s2 s3 s2 s21 s1 s5 s22 s1 s23 s6 s4 s25 s8 s24 s9 s12 s10 s8 s7 s13 s11 maxse maxse se3 Spo0E Spo0E se3 se1 s2 s21 s22 s1 s23 s25 s24 se1 s8 maxab maxab s2 s3 s1 s5 s6 s4 s8 s9 s12 s10 s7 s13 AbrB s11 AbrB ab1 ab1 s2 s21 s2 s22 s3 s1 s23 s1 s5 s25 s24 s8 s6 s4 s8 s9 s12 s10 s7 s13 s11 maxf maxf SigF SigF s2 s3 s1 s5 s2 s21 s6 s4 s22 s1 s8 s23 s9 s12 s10 s7 s13 s25 s24 s8 s11 maxsi maxsi SinI SinI si1 si1 s2 s3 s1 s5 s6 s4 s8 s9 s2 s12 s10 s21 s7 s13 s22 s1 s23 s25 s24 s11 s8 Sporulation vs. division behaviors
H H A F spo0E kinA Analysis of simulation results • Qualitative simulation shows that initiation of sporulation is outcome of competing positive and negative feedback loops regulating accumulation of Spo0A~P Grossman, 1995; Hoch, 1993 • Sporulation mutants disable positive or negative feedback loops KinA + + + phospho- relay Spo0A˜P + Spo0A - + sigF Spo0E
Simulation of stress adaptation in E. coli • Adaptation of E. coli to stress conditions controlled by network of global regulators of transcription Fis, Crp, H-NS, Lrp, RpoS,… • Network only partially known and no global view of its functioning available • Computational and experimental study directed at understanding of: • How network controls gene expression to adapt cell to stress conditions • How network evolves over time to adapt to environment • Project inter-EPST « Validation de modèles de réseaux… » ENS, Paris ; INRIA RA ; UJF, Grenoble
k2 wt fis- k20 topA- k2 topA+ fis- topA- Data on stress adaptation • Gene transcription changes dramatically when the network is perturbed by a mutation • Small signaling molecules participate in global regulation mechanisms (cAMP, ppGpp, …) • The superhelical density of DNA modulates the activity of many bacterial promoters
Stress adaptation network • Preliminary working model of the regulatory network controlling stress adaptation ATP ¬Nut Crp + − − − + cAMP Fis − crp fis Crp•cAMP GyrAB − − super- coiling + + + − gyrAB topA GyrAB•SmbC − + SmbC ClpXP rpoS smbC RssB•p + RpoS Nut p RssB rssB
wt Suppressor crp Evolution of stress adaptation network • Stress adaptation network evolves rapidly towards an optimal adaptation to a particular environment • Small changes of the regulatory network have large effects on gene expression
Conclusions • Implemented method for qualitative simulation of large and complex genetic regulatory networks Method based on work in mathematical biology and qualitative reasoning • Method validated by analysis of regulatory network underlying initiation of sporulation in B. subtilis Simulation results consistent with observations • Method currently applied to analysis of regulatory network controlling stress adaptation in E. coli Simulation yields predictions that can be tested in the laboratory
Work in progress • Validation of models of regulatory networks using gene expression data Model-checking techniques • Search of attractors in phase space and determination of their stability • Further development of computer tool GNA Model editor, connection with biological knowledge bases, … • Study of bacterial regulatory networks Sporulation in B. subtilis, phage Mu infection of E. coli, signal transduction in Synechocystis, stress adaptation in E. coli
Contributors Grégory Batt INRIA Rhône-Alpes Hidde de Jong INRIA Rhône-Alpes Hans Geiselmann Université Joseph Fourier, Grenoble Jean-Luc Gouzé INRIA Sophia-Antipolis Céline Hernandez INRIA Rhône-Alpes, now at SIB, Genève Michel Page INRIA Rhône-Alpes, Université Pierre Mendès France, Grenoble Tewfik Sari Université de Haute Alsace, Mulhouse Dominique Schneider Université Joseph Fourier, Grenoble
References de Jong, H. (2002), Modeling and simulation of genetic regulatory systems: A literature review, J. Comp. Biol., 9(1):69-105. de Jong, H., J. Geiselmann & D. Thieffry (2003), Qualitative modelling and simulation of developmental regulatory networks, On Growth, Form, and Computers, Academic Press,109-134. de Jong, H., J. Geiselmann, C. Hernandez & M. Page (2003), Genetic Network Analyzer: Qualitative simulation of genetic regulatory networks, Bioinformatics,19(3):336-344. Gouzé, J.-L. & T. Sari (2003), A class of piecewise-linear differential equations arising in biological models, Dyn. Syst., 17(4):299-316. de Jong, H., J.-L. Gouzé, C. Hernandez, M. Page, T. Sari & J. Geiselmann (2002), Qualitative simulation of genetic regulatory networks using piecewise-linear models, RR-4407, INRIA. de Jong, H., J. Geiselmann, G. Batt, C. Hernandez & M. Page (2002), Qualitative simulation of the initiation of sporulation in B. subtilis, RR-4527, INRIA. GNA web site:http://www-helix.inrialpes.fr/gna
maxb b2 b1 0 a2 a1 maxa Soundness of qualitative simulation • Qualitative simulation is sound: Given qualitative PL model and initial domain D0 Let X be set of solutions x(t) on [0, ] of quantitative PL models corresponding to qualitative model, such that x(0) D0 Every x Xcovered by some path in transition graph QS8 QS7 QS5 QS6 QS4 QS3 QS1 QS2