Download
1 / 57
580 likes | 590 Views
Chapter 8 Analysis Modeling Part I Elements and methods of analysis modeling. Requirements Analysis Requirements analysis specifies software’s operational characteristics indicates software's interface with other system elements establishes constraints that software must meet

E N D
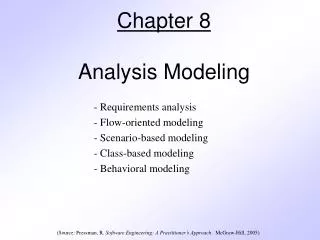
Chapter 8 Analysis Modeling Part I Elements and methods of analysis modeling
Requirements Analysis • Requirements analysis • specifies software’s operational characteristics • indicates software's interface with other system elements • establishes constraints that software must meet • Requirements analysis allows the software engineers to: • elaborate on basic requirements established during earlier requirement tasks • build models to depict user scenarios, functional activities, needed classes and their relationships, system behavior, and data flow and transformation. • define requirements that can be validated once the system is built (bridging system description and deign model)
Modeling Rules of Thumb • The model should focus on requirements that are visible within the problem or business domain. The level of abstraction should be relatively high. • Each element of the model should add to the understanding of the requirements and provide insight into the information domain, functions, and behavior of the system. • Delay consideration of infrastructure and other non-functional models until design. • Minimize coupling throughout the system (less dependency). • The analysis model should provide value to all stakeholders (customer, designer, QA). • Keep the model as simple as possible.
Domain Analysis - 1 “Software domain analysis is the identification, analysis, and specification of common requirements from a specific application domain, typically for reuse on multiple projects within that application domain . . . [Object-oriented domain analysis is] the identification, analysis, and specification of common, reusable capabilities within a specific application domain, in terms of common objects, classes, subassemblies, and frameworks . . .” Donald Firesmith
Domain Analysis - 2 • Define the domain to be investigated • Collect a representative sample of applications in the domain • Analyze each application in the sample • Develop an analysis model for the objects
technical literature Sources of domain Knowledge class taxonomies Domain Analysis Model existing applications reuse standards DOMAIN ANALYSIS customer surveys functional models expert advice domain languages current/future req. Domain Analysis - 3 Why do it? To build robust reusable components, lower cost, higher quality, and improve time to market.
Analysis Modeling Approaches - 1 What is Analysis Modeling? A set of modeling activities that result in technical representation (using text and diagrams) of system requirements (data, functions, and behavior). How do we conduct it? - Structured Analysis (data objects and processes) - OOA (classes and object relationships) Note that all approaches lead to same modeling elements. The difference is in the representation.
Analysis Modeling Approaches - 2 Why do Analysis Modeling? • to represent/express customer requirements/needs of the system • to build groundwork/foundations for the design phase • to define system requirements that can be validated once the application is developed
Analysis Modeling Approaches - 3 Where to begin? - Prepare statement of scope derived from the FAST meeting document and/or use-cases. - Parse the statement of scope to extract data, function, and behavioral domain information. A scope document may include, but not limited to, the following info: - inputs and outputs (data and controls) - functions of the system - performance and reliability requirements - interface requirements - constraints and limitations that may be applicable to data and functions
How to Identify Data Objects and Functions Define “data objects” by underlining all nouns in the statement of scope - producers/consumers of data - places where data are stored - composite data items Define “functions” by double underlining all active verbs - processes relevant to the application - data transformations - services that will be required by the data objects
Section 8.3: Data Modeling What is it? - identifying data objects of the system, - defining the attributes for each data object, - identifying relationships among data objects, and - creating a model at the customer’s level of abstraction. Purpose: To examine data objects independently of processing. Main elements of the data model are: Data objects, Attributes, and Relationships.
Data Objects - 1 What is a data object? It is an entity of the system described by a set of attributes (data items) and that will be manipulated by the software system. Each instance of a data object (student) is uniquely identified by an attribute (student ID). Each data object plays a role in the system and the system could not function without access to instances of that object. Data objects and their attributes are stored in the data dictionary.
Data Objects - 2 Typical data objects: - external entities (printer, user, sensor, copier, fax, car) - things (reports, displays, signals) - occurrence/event (phone call, alarm, transmission) - roles (manager, engineer, salesperson, student, faculty) - organizational units (division, team, department, college) - places (assembly line, storage, classroom, launch pad) - structures (employee record, transcript, class schedule)
Object: Student Attributes: Name ID Home Address Work Address Personal Info Academic Info ... Object: Car Attributes: Make Model ID Color Body type Price ... Attributes A data object has a set of attributes (data items or variables) that act as an aspect, quality, characteristic, or descriptor of the object.
Data Item Information Name Alias Data Structure (type) Description Duration (begin) Accuracy Range of values Data flow … Description Identifies data items Other names and abbreviations Type of data (int, float, char, etc…) Indicates how and why data items is used Life span of data item (when created) Indicates accuracy level (high, medium, low) Indicates valid values Process(es) that create/receive data item … Data Dictionary View Data dictionary information for a data item (e.g., student name) of a data object (e.g., student).
Relationships A relationship indicates connection between data objects. - Relationships are not computed, they are facts that the system needs to know about. - Several instances of a relationship can exist between data objects. - Data objects can be related in many different ways. e.g., John owns the car John drives the car Amy owns the van John married to Amy See figure 8.5, page 183 for diagrammatic representation.
object object relationship 1 2 (m, 1) (1, 1) attribute relationship (0, 1) object (m, 0) object 1 2 Cardinality and Modality Notation Cardinality: max number of occurrences of objects in a relationship (number/symbol closer to the object) (1:1, 1:n, m:n) Modality: indicates whether the relation is optional or required. (2nd number of the pair or the further away symbol)
request for service places Customer (1,1) (1,m) (1,1) (1,n) standard task table work order generates (1,1) (1,1) (1,1) work tasks selected from consists of (1,1) (1,n) (1,1) materials lists ERD Example
Domain Engineering System Engineering OO Engineering Software Engineering Section 8.4: OO Analysis The Big Picture Domain Level System Level OO Analysis OO Design Implementation OO Testing Deployment Structured Analysis Structured Design Implementation Procedural Testing Deployment
Structured Analysis Structured Design Implementation Procedural Testing Deployment OO Analysis OO Design Implementation OO Testing Deployment Object Behavior Modeling Object Relationship Modeling Class Modeling Data Modeling Behavioral Modeling Functional Modeling The Big Picture
OO Concepts • OO concepts must be understood to apply class-based elements of the analysis model • Key concepts: • Classes and objects • Attributes and operations • Encapsulation and instantiation • Inheritance
Classes • Object-oriented thinking begins with the definition of a class, often defined as: • template • generalized description • “blueprint” ... describing a collection of similar items • A metaclass (also called a superclass) establishes a hierarchy of classes • Once a class of items is defined, a specific instance of the class can be identified
occurrences roles organizational units things places external entities structures class name attributes: operations: What is in a Class
The object encapsulates both data and the logical procedures required to manipulate the data method # 2 method # 1 data method # 3 method # 6 method # 4 method # 5 Encapsulation
PieceOfFurniture (superclass) Table Chair Desk ”Shelf" Class Hierarchy
Methods An executable procedure that is encapsulated in a class and is designed to operate on one or more data attributes that are defined as part of the class. A method is invoked via message passing.
SA vs. OOA SA: Focus on functionaldecomposition Input-Process-Output view Data is separate from processes OOA: Focus on objects Real-world view Data and processes are grouped together
OOA Methods OOA methods vary in their process steps, diagrams, notations, terminologies, but they all share an overall process and produce similar results. Examples: • Booch method • Rumbaugh method • Jacobson method • Coad/Yourdon method • Wirfs/Brock method Later become the unified approach (Unified Modeling Language - UML)
The UML Approach UML is a modeling language that can be used with any modeling method/process. UML components: Syntax ===> the look of each symbol. Semantic ===> the meaning of each symbol. Pragmatic Rules ===> the intention/purpose of grouped symbols. UML Views of a System: User model view (user view via use-cases) Structural model view (data and functionality view - static structure) Behavioral model view (object interactions view - dynamic structure) Implementation model view (the software details) Environment model view (the environment aspects - static/dynamic)
OO Analysis OO Design Implementation OO Testing Deployment Object Behavior Modeling Object Relationship Modeling Class Modeling Key Components of OOA Static components: - classes class attributes (to define object states) class relationships (to define object operations/messages) Dynamic components: - interactions among objects (object communications) - control events that cause state transitions
OOA Process • Define use-cases (next few slide) • Extract/Select candidate classes • Identify attributes for each class • Specify methods that service the attributes of each class • Establish basic class relationships • Define a class hierarchy • Build a behavioral model Repeat these steps for lower-level (other) use-cases. Steps 2 -5 are done using CRC modeling approach.
8.5: Scenario-Based Modeling “[Use-cases] are simply an aid to defining what exists outside the system (actors) and what should be performed by the system (use-cases).” Ivar Jacobson • A scenario that describes a thread of usage for a system • Actors represent the roles entities (people or devices) play as the system functions • An entity (user) can play a number of different roles for a given scenario • High-level use-case may be elaborated by lower-level use-cases • In UML, use-cases are represented by use-case diagrams, activity diagrams, and swimlane diagrams.
Use-Cases Developing use-cases: - What are the main tasks (functions) that the actors performs? - What system information will the the actor acquire, produce or change? - Will the actor have to inform the system about changes in the external environment? - What information does the actor desire from the system? - Does the actor wish to be informed about unexpected changes? Please read the report “Structuring Use Cases with Goals” at: http://alistair.cockburn.us/Structuring+use+cases+with+goals
Description of Use-Cases Textual description can be in any format. (See author’s approach on page 188) For this class, we are following a table format. A template is given in the “SRS Components” document on the website. (compare the template to the that on page 190) Examples of use-case descriptions are posted on the Project Page.
Use-Cases Diagram Page 191.
Activity and Swimlane Diagrams Activity diagram (similar to flowchart) supplements a use-case by providing a diagrammatic representation of procedural flow (flow of events in a scenario)See example page 192. Swimlane diagram is a variation of the activity diagram. It allows the representation of the flow of activities described by the use-case and it indicates which actor (if multiple actors are involved) or analysis class has responsibility for the action described by an activity rectangle (Diamonds). See example page 193. Read this section 8.4 for Safehome example.
Section 8.6: Flow-Oriented Modeling (for Structured Analysis) Data Flow Diagram (DFD) represents data flow (information flow modeling) as data elements are being processed (functional modeling) in the system DFD is a formal part of UML. However, it complements UML representation DFD allows system representation at any level (level 0, etc…) Elements of a DFD include: external entity, process, and data flow, and data store.
external entity process data flow data store Flow Modeling Notation
A producer or consumer of data Examples: a person, a device, a sensor, a computer-based system Data must always originate somewhere and must always be sent to something (process or entity). External Entity
A data transformer (changes input to output) Examples: compute taxes, determine area, format report, display graph, print report, etc… Data must always be processed in some way to achieve system function. Process
base compute triangle area area height Data Flow Data flows through a system, beginning as input and be transformed into output.
sensor # sensor #, type, location, age look-up sensor data report required type, location, age sensor number sensor data Data Store Data is often stored for later use.
Building a DFD • Review ERD to isolate data objects and apply grammatical parse to determine operations • Determine external entities (producers and consumers of data objects) • Develop a level 0 DFD • Write a narrative describing the transform (operations) • Parse the narrative to determine next level operations • Maintain data flow continuity • Develop a level 1 DFD • Use a 1:5 (approx.) expansion ratio • Repeat steps 4 - 7 for other detailed levels (refinement)
DFD Guideline • All icons must be labeled with meaningful names • The DFD evolves through a number of levels of detail • Always begin with a context level diagram (level 0) • Always show external entities at level 0 • Always label data flow arrows • Do not represent procedural logic (loop and decisions) • Each process is refined until it does just one thing/task • The expansion ratio decreases as the number of levels increase
user processing request requested video signal digital video processor monitor video source video signal Level 0 DFD Example
a b P x y level 0 c p2 a f p1 b p4 d 5 g p3 e level 1 Data Flow Hierarchy See Figures 8.10 and 8.11, page 196.
Analysis model Maps into Design model DFD and Design
Behavioral (Control Flow) Modeling (For Structured Analysis) Behavioral (control flow) modeling is modeling how the software will interact with external entities (events and control items). A State Transition Diagram (STD) shows system states, events that cause state transition, and actions taken in response to events. State: observable circumstances that characterizes the behavior of a system at a given time. Event: an occurrence that causes the system to exhibit some predictable form of behavior. Action: process that occurs as a consequence of making a transition.
Behavioral Representation How to begin? - Identify a list of the different states of a system (How does the system behave?) - indicate how the system makes a transition from one state to another (How does the system change state?) - events (clock signals, interrupt conditions, switches, …) - actions (responses to events/requests) - develop STD