Download
1 / 1
10 likes | 111 Views
High-resolution limb-observations of water vapour and clouds in the UTLS region. Martin Riese, Binh Trieu, Gebhard Günther, and Reinhold Spang.

E N D
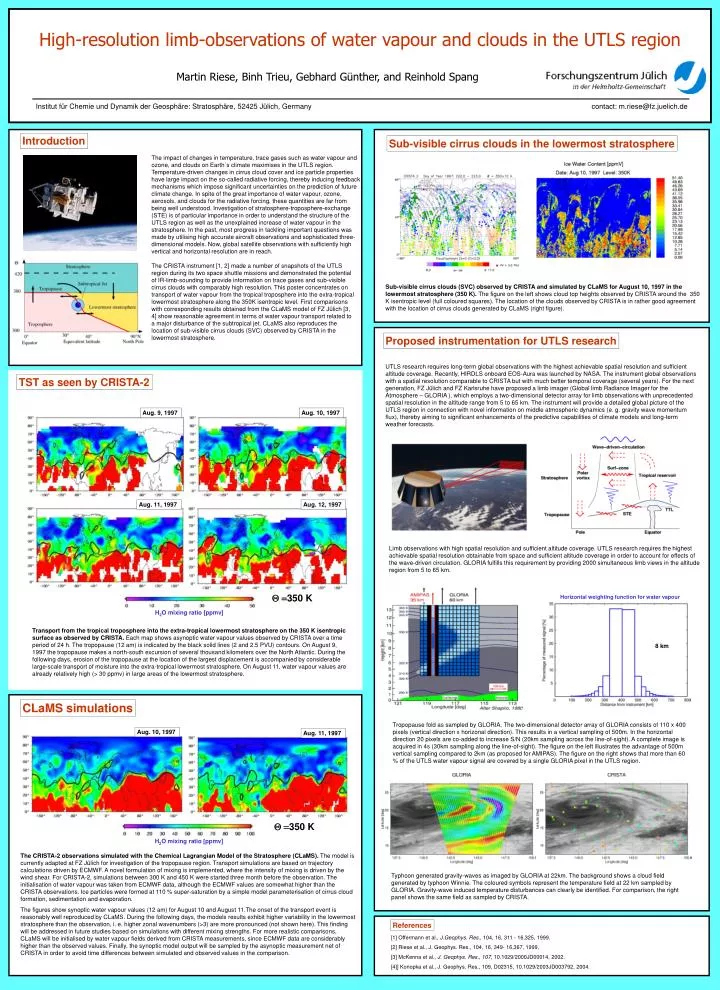
High-resolution limb-observations of water vapour and clouds in the UTLS region Martin Riese, Binh Trieu, Gebhard Günther, and Reinhold Spang Institut für Chemie und Dynamik der Geosphäre: Stratosphäre, 52425 Jülich, Germany contact: m.riese@fz.juelich.de Introduction Sub-visible cirrus clouds in the lowermost stratosphere The impact of changes in temperature, trace gases such as water vapour and ozone, and clouds on Earth´s climate maximises in the UTLS region. Temperature-driven changes in cirrus cloud cover and ice particle properties have large impact on the so-called radiative forcing, thereby inducing feedback mechanisms which impose significant uncertainties on the prediction of future climate change. In spite of the great importance of water vapour, ozone, aerosols, and clouds for the radiative forcing, these quantities are far from being well understood. Investigation of stratosphere-troposphere-exchange (STE) is of particular importance in order to understand the structure of the UTLS region as well as the unexplained increase of water vapour in the stratosphere. In the past, most progress in tackling important questions was made by utilising high accurate aircraft observations and sophisticated three-dimensional models. Now, global satellite observations with sufficiently high vertical and horizontal resolution are in reach. The CRISTA instrument [1, 2] made a number of snapshots of the UTLS region during its two space shuttle missions and demonstrated the potential of IR-limb-sounding to provide information on trace gases and sub-visible cirrus clouds with comparably high resolution. This poster concentrates on transport of water vapour from the tropical troposphere into the extra-tropical lowermost stratosphere along the 350K isentropic level. First comparisons with corresponding results obtained from the CLaMS model of FZ Jülich [3, 4] show reasonable agreement in terms of water vapour transport related to a major disturbance of the subtropical jet. CLaMS also reproduces the location of sub-visible cirrus clouds (SVC) observed by CRISTA in the lowermost stratosphere. Sub-visible cirrusclouds (SVC) observed by CRISTA and simulated by CLaMS for August 10, 1997 in the lowermost stratosphere (350 K). The figure on the left shows cloud top heights observed by CRISTA around the 350 K isentropic level (full coloured squares). The location of the clouds observed by CRISTA is in rather good agreement with the location of cirrus clouds generated by CLaMS (right figure). Proposed instrumentation for UTLS research UTLS research requires long-term global observations with the highest achievable spatial resolution and sufficient altitude coverage. Recently, HIRDLS onboard EOS-Aura was launched by NASA. The instrument global observations with a spatial resolution comparable to CRISTA but with much better temporal coverage (several years). For the next generation, FZ Jülich and FZ Karlsruhe have proposed a limb imager (Global limb Radiance Imager for the Atmosphere – GLORIA ), which employs a two-dimensional detector array for limb observations with unprecedented spatial resolution in the altitude range from 5 to 65 km. The instrument will provide a detailed global picture of the UTLS region in connection with novel information on middle atmospheric dynamics (e. g. gravity wave momentum flux), thereby aiming to significant enhancements of the predictive capabilities of climate models and long-term weather forecasts. TST as seen by CRISTA-2 Aug. 9, 1997 Aug. 10, 1997 Aug. 11, 1997 Aug. 12, 1997 Limb observations with high spatial resolution and sufficient altitude coverage. UTLS research requires the highest achievable spatial resolution obtainable from space and sufficient altitude coverage in order to account for effects of the wave-driven circulation. GLORIA fulfills this requirement by providing 2000 simultaneous limb views in the altitude region from 5 to 65 km. Q =350 K Horizontal weighting function for water vapour H2O mixing ratio [ppmv] Transport from the tropical troposphere into the extra-tropical lowermost stratosphere on the 350 K isentropic surface as observed by CRISTA. Each map shows asynoptic water vapour values observed by CRISTA over a time period of 24 h. The tropopause (12 am) is indicated by the black solid lines (2 and 2.5 PVU) contours. On August 9, 1997 the tropopause makes a north-south excursion of several thousand kilometers over the North Atlantic. During the following days, erosion of the tropopause at the location of the largest displacement is accompanied by considerable large-scale transport of moisture into the extra-tropical lowermost stratosphere. On August 11, water vapour values are already relatively high (> 30 ppmv) in large areas of the lowermost stratosphere. 8 km CLaMS simulations Tropopause fold as sampled by GLORIA. The two-dimensional detector array of GLORIA consists of 110 x 400 pixels (vertical direction x horizonal direction). This results in a vertical sampling of 500m. In the horizontal direction 20 pixels are co-added to increase S/N (20km sampling across the line-of-sight). A complete image is acquired in 4s (30km sampling along the line-of-sight). The figure on the left illustrates the advantage of 500m vertical sampling compared to 2km (as proposed for AMIPAS). The figure on the right shows that more than 60 % of the UTLS water vapour signal are covered by a single GLORIA pixel in the UTLS region. Aug. 10, 1997 Aug. 11, 1997 Q =350 K H2O mixing ratio [ppmv] The CRISTA-2 observations simulated with the Chemical Lagrangian Model of the Stratosphere (CLaMS). The model is currently adapted at FZ Jülich for investigation of the tropopause region. Transport simulations are based on trajectory calculations driven by ECMWF. A novel formulation of mixing is implemented, where the intensity of mixing is driven by the wind shear. For CRISTA-2, simulations between 300 K and 450 K were started three month before the observation. The initialisation of water vapour was taken from ECMWF data, although the ECMWF values are somewhat higher than the CRISTA observations. Ice particles were formed at 110 % super-saturation by a simple model parameterisation of cirrus cloud formation, sedimentation and evaporation. The figures show synoptic water vapour values (12 am) for August 10 and August 11.The onset of the transport event is reasonably well reproduced by CLaMS. During the following days, the models results exhibit higher variability in the lowermost stratosphere than the observation, i. e. higher zonal wavenumbers (>3) are more pronounced (not shown here). This finding will be addressed in future studies based on simulations with different mixing strengths. For more realistic comparisons, CLaMS will be initialised by water vapour fields derived from CRISTA measurements, since ECMWF data are considerably higher than the observed values. Finally, the synoptic model output will be sampled by the asynoptic measurement net of CRISTA in order to avoid time differences between simulated and observed values in the comparison. Typhoon generated gravity-waves as imaged by GLORIA at 22km. The background shows a cloud field generated by typhoon Winnie. The coloured symbols represent the temperature field at 22 km sampled by GLORIA. Gravity-wave induced temperature disturbances can clearly be identified. For comparison, the right panel shows the same field as sampled by CRISTA. References [1] Offermann et al., J.Geophys. Res., 104, 16, 311 - 16,325, 1999. [2] Riese et al., J. Geophys. Res., 104, 16, 349- 16,367, 1999. [3] McKenna et al., J. Geophys. Res., 107, 10.1029/2000JD00014, 2002. [4]] Konopka et al., J. Geophys. Res., 109, D02315, 10.1029/2003JD003792, 2004.