Download
1 / 28
280 likes | 402 Views
The European Forest and Agricultural Sector Optimization Model (EUFASOM). Uwe A. Schneider Research Unit Sustainabilty and Global Change Hamburg University. FASOM History. US (1993) EU (2004) Global (2006). FASOM. Partial Equilibrium Model Maximizes sum of consumer and producer surplus

E N D
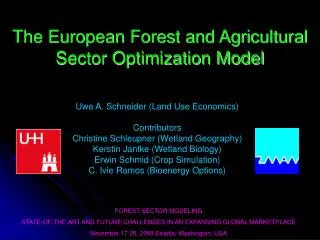
The European Forest and Agricultural Sector Optimization Model (EUFASOM) Uwe A. Schneider Research Unit Sustainabilty and Global Change Hamburg University
FASOM History • US (1993) • EU (2004) • Global (2006)
FASOM • Partial Equilibrium Model • Maximizes sum of consumer and producer surplus • Constrained by resource endowments, technologies, policies • Spatially explicit, discrete dynamic • Integrates environmental effects • Programmed in GAMS
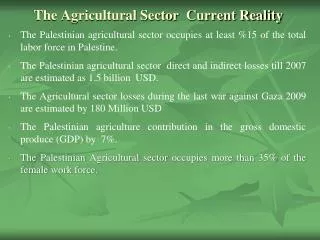
Purpose and Objectives To advice policy makers about the agricultural and forestry sector response to structural changes • Policies • Environmental change • Technical change • Socioeconomic change
Policy Scope • Climate and other environmental policies • Research subsidies • Agricultural policies • Trade policies Simultaneous assessment
Bioenergy Biomaterial Food Timber Fiber Land use competition Nature Reserves Carbon Sinks Sealed Land
Objective Function Price Supply Consumer Surplus P* Resource Rents Demand Q* Quantity
Land Supply Forest Inventory Processing Demand Water Supply CS Domestic Demand PS Labor Supply Implicit Supply and Demand Feed Demand Animal Supply National Inputs Export Demand Import Supply Surplus Maximization
Commodity Demand • 4 general cases (above) • For all final products • For all regions • Domestic Use, Export
Model Structure Limits Limits Resources Land Use Technologies Products Markets Inputs Demand Functions, Trade Processing Technologies Environmental Impacts Supply Functions Limits
Model Structure Forest Inventory Cropland Domestic demand Markets Water Forestry, Nature, Crop production Export Labor Processing Import Other Inputs Livestock production Feed mixing Pasture
Spatial Resolution • Political regions • Ownership (forests) • Farm types • Farm size • Soil texture • Stone content • Altitude levels • Slopes • Soil state • Many crop and tree species • Tillage, planting irrigation, fertilization harvest regime
Homogeneous Response Units • Altitude: • < 300 m • 300-600 m • 600-1100 m • >1100 m • Slope Class: • 0-3% • 3-6% • 6-10% • 10-15% • … DE11 DE12 • Texture: • Coarse • Medium • Medium-fine • Fine • Very fine DE14 • Soil Depth: • shallow • medium • deep DE13 • Stoniness: • Low content • Medium content • High content
EUFASOM Dynamics • 5 (to 20) year time steps • State of forests (and soil organic matter) • Technical progress • Demand & industry growth • Resource and global change • Policy scenarios
State of the Art • Flexibility (resolve acc. needs) • Index notation • millions of data, variables, and equations with sparse programming statements • ensures consistency (model development) • Extensive generic equation checks (30 checks per equation) • Systematic solution analysis (symptom to cause)
Positive VariablesRESOURCE_VAR (PERIOD,REGION,RESOURCE) FOREST_VAR (PERIOD,REGION,SOILTYPE,SOILSTATE,SPECIES,OWNER,AGE,FORTECH) PEREN_VAR (PERIOD,REGION,SOILTYPE,SOILSTATE,SPECIES,FARM,AGE,CROPTECH) CROP_VAR (PERIOD,REGION,SOILTYPE,SOILSTATE,SPECIES,FARM,CROPTECH) LIVE_VAR (PERIOD,REGION,ANIMAL,LIVETECH) FEED_VAR (PERIOD,REGION,ANIMAL,PRODUCT,FEEDTECH)ECO_VAR (PERIOD,REGION,SOILTYPE,SOILSTATE,ECOTECH) PROCESS_VAR (PERIOD,REGION,PROCTECH) LUC_VAR (PERIOD,REGION,SOILTYPE,SPECIES,CHANGE) DEMAND_VAR (PERIOD,REGION,PRODUCT) SUPPLY_VAR (PERIOD,REGION,PRODUCT) TRADE_VAR (PERIOD,REGION,REGION,PRODUCT)
EquationsOBJECTIVE_EQU RESOURCEBAL_EQU (PERIOD,REGION,RESOURCE) RESOURCEMAX_EQU (PERIOD,REGION,RESOURCE) SOILSTATE_EQU (PERIOD,REGION,SOILTYPE,SOILSTATE) FORINVENT_EQU (PERIOD,REGION,SOILTYPE,SOILSTATE,SPECIES,OWNER,AGE,FORTECH) LUC_EQU (PERIOD,REGION,SOILTYPE,SPECIES,CHANGE) LUCLIMIT_EQU (PERIOD,REGION,SOILTYPE,SPECIES,CHANGE) STOCK_EQU (PERIOD,REGION,STOCK)EMIT_EQU (PERIOD,REGION,SUBSTANCE)PRODUCTBAL_EQU (PERIOD,REGION,PRODUCT) MINFEED_EQU (PERIOD,REGION,ANIMAL,NUTRIENT) MAXFEED_EQU (PERIOD,REGION,ANIMAL,NUTRIENT)
DataFOREST_DATA (PERIOD,REGION,SOILTYPE,SOILSTATE,SPECIES,FARM,AGE,ALLTECH,ALLITEM)PEREN_DATA (PERIOD,REGION,SOILTYPE,SOILSTATE,SPECIES,FARM,AGE,ALLTECH,ALLITEM)CROP_DATA (PERIOD,REGION,SOILTYPE,SOILSTATE,SPECIES,FARM,ALLTECH,ALLITEM)ECO_DATA (PERIOD,REGION,SOILTYPE,SOILSTATE,ALLTECH,ALLITEM)LIVE_DATA (PERIOD,REGION,ANIMAL,ALLTECH,ALLITEM)FEED_DATA (PERIOD,REGION,PRODUCT,ALLTECH,ALLITEM)PROCESS_DATA (PERIOD,REGION,ALLTECH,ALLITEM)PRODUCT_DATA (PERIOD,REGION,PRODUCT,ALLITEM)MARKET_DATA (PERIOD,REGION,ALLITEM,SDTYPE,SDITEM)TRADE_DATA (PERIOD,REGION,REGION,PRODUCT,ALLITEM)RESOURCE_DATA (PERIOD,REGION,ALLRESOURCE,SDITEM)STOCK_DATA (PERIOD,REGION,PRODUCT,ALLITEM)LUC_DATA (PERIOD,REGION,SOILTYPE,SPECIES,ALLCHANGE,ALLITEM)
Pre-Solution Analysis • Identifies structural errors • Missing data • Misspecified data • Wrong signs • More than 30 general variable and equation checks
Mitigation Potentials 500 450 400 Technical Potential 350 Competitive Potential 300 Carbon price (Euro/tce) 250 200 150 100 50 0 0 100 200 300 400 500 600 700 800 Mitigation (mmtce)
Changes in Welfare Accounts 8 6 4 Gross Ag-Producer Surplus 2 Net Ag-Producer Surplus 0 Billion Euros -2 Emission Payments -4 -6 Ag-ConsumerSurplus -8 -10 0 20 40 60 80 100 Carbon Equivalent (CE) Prices in Euros per Ton
Crop prices Livestock prices Livestock production Crop production Net exports GHG Mitigation and Markets 220 200 180 160 140 Fisher index 120 100 80 60 40 20 0 50 100 150 200 250 300 Carbon price (Euro/tce)
Afforestation Potentials 500 400 Economic Potential 300 Carbon price (Euro/tce) Competitive Economic Potential 200 100 Technical Potential 0 0 50 100 150 200 250 300 Emission reduction (mmtce)
Forest Policy: Crop Emissions 15 10 IrrigationUse Nitrogen Fertilizer 5 Emissions (kg C/ha) 0 Fossil Fuel Use -5 -10 Ag-Soil Carbon -15 0 50 100 150 200 250 300 Carbon price (Euro/tce)
500 450 400 Independent Geographic Potential 350 Competitive Economic Potential 300 Carbon Price in Euro/mtce 250 Simult. Technical Potential 200 150 Independent Technical Potential 100 50 0 0 100 200 300 400 500 600 700 800 900 Total Agricultural Greenhouse Gas Emission Abatement in mmtce
500 Crop Area Fixed 450 Crop Area and Prices Fixed 400 Crop Area and Prices Endogenous 350 300 Carbon Price in Euro/mtce 250 200 Prices Fixed 150 100 50 0 0 100 200 300 400 500 600 700 Total Agricultural and Forest Greenhouse Gas Emission Abatement in mmtce
Power Plant Biomass Supply 80 70 Unrestricted Capacity 60 50 2050 Capacity Energy Crops (million hectares) 40 30 2030 Capacity 20 10 2010 Capacity 0 0 20 40 60 80 100 Carbon tax on energy (Euro/ton of carbon)