Download
1 / 31
310 likes | 597 Views
Asian-Americans in Oregon. A brief summary. Activity!. Your sticky note will be used at the end of this presentation to label the maps of Asia and Pacific Island countries. . FIRST!.

E N D
Asian-Americans in Oregon A brief summary
Activity! Yoursticky note will be used at the end of this presentation to label the maps of Asia and Pacific Island countries. FIRST! Please take notes on your blank map - and begin to outline the areas of origin included in "Asian and Pacific Islander" category - ...this will help with the activity.
Where are the countries of origin, included in the category of "Asian and Pacific Islander", located on a map? South Asia Bangladesh Bhutan India Nepal Pakistan Sri Lanka Southeast Asia Brunei Cambodia Indonesia Laos Malaysia Myanmar Philippines Singapore Thailand Vietnam East Asia China Japan Mongolia North Korea South Korea Taiwan Please check your sticky note to find out if your country will be part of the map of Asia and Pacific Island activity... - some of you will have two, check carefully! Western Pacific Guam Marshall Islands Micronesia Northern Mariana Islands Palau Papua New Guinea Solomon Islands Wake Island South Pacific Fiji New Caledonia Tahiti Tonga Vanuatu Wallis & Futuna Eastern Pacific American Samoa French Polynesia Kiribati Nauru Pitcairn Island Samoa Tuvalu North Pacific Hawaii
Who Are They?"APA is an abbreviation for "Asian-Pacific Americans," a general term referring to (people of Asian and Pacific Islander descent) following a definition of race and national origin by the Office of Management and Budget." Office of Management and Budget/Census Bureau http://www.imdiversity.com/villages/asian/reference/census_what_is_an_apa.asp Asian Pacific Islander Bangladeshi Javanese Carolinian Tarawa Islander Bhutanese Korean Fijian Tokelauan Borneo Laotian Guamanian Gongan Burmese Malayan Hawaiian Trukese (Chuukese) Cambodian Maldivian Kosraean Yapese Celebesian Nepali Melanesian Ceram Okinawan North Mariana Islander Chinese Other Asian Other Pacific Islander Filipino Pakistani Pacific Islander, not specified Hmong Sikkim Palauan Indian Singaporean Papua New Guinean Indochinese Sri Lankan Polynesian Indonesian Sumatran Ponapean (Pohnpeian) Iwo-Jiman Thai Samoan Japanese Vietnamese Solomon Islander Asian, not specified (2)
Countries of Asia Included in “Asian and Pacific Islander” Category South Asia Afghanistan Bangladesh Bhutan India Nepal Pakistan Sri Lanka
Countries of Asia Included in “Asian and Pacific Islander” Category Southeast Asia Brunei Cambodia Indonesia Laos Malaysia Myanmar Philippines Singapore Thailand Vietnam
Countries of Asia Included in “Asian and Pacific Islander” Category East Asia China Japan Mongolia North Korea South Korea Taiwan
Countries of Asia Included in “Asian and Pacific Islander” Category
Countries of Asia NOT Included in “Asian and Pacific Islander” Category North Asia (Former USSR) Armenia Azerbaijan Georgia Kazakhstan Kyrgyzstan Russia Tajikistan Turkmenistan Uzbekistan South Asia Afghanistan
Countries of the Pacific Ocean that are included in “Asian and Pacific Islander” Category South Pacific Australia Fiji New Caledonia New Zealand Tahiti Tonga Vanuatu Wallis & Futuna
Countries of the Pacific Ocean that are included in “Asian and Pacific Islander” Category Eastern Pacific American Samoa French Polynesia Kiribati Nauru Pitcairn Island Samoa Tuvalu North Pacific Hawaii
Countries of the Pacific Ocean that are included in “Asian and Pacific Islander” Category Western Pacific Guam Marshall Islands Micronesia Northern Mariana Islands Palau Papua New Guinea Solomon Islands Wake Island
Countries of the Pacific Ocean that are included in “Asian and Pacific Islander” Category
Countries of the Pacific Ocean NOT Included in “Asian and Pacific Islander” Category South Pacific Australia New Zealand
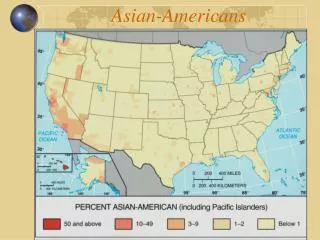
Asian populations in the United States - 1990 Asians of various ethnicity comprise 95% of the total Asian and Pacific Islander population South Asian: Indians, Pakistanis, Bangladeshis, and Sri Lankans http://www.cdc.gov/dhdsp/library/maps/cvdatlas/atlas_womens/05-section3.htm
1. The Hawaiian Islanders were among the earliest Asian Pacific groups to migrate to the Pacific Northwest. Hawaiians came in the late 18th and early 19th centuries to work for fur-trading companies such as the Hudson's Bay Company at Fort Vancouver. 2. The Chinese were the next Pacific Asian group to arrive in the Oregon Territory in the early 1850s. With the discovery of gold in southern Oregon in the early 1850s, hundreds of Chinese immigrants traveled to the Oregon Territory. 3. Throughout the latter part of the nineteenth century Chinese and Japanese laborers came to work in the railway industry. 4. In the late 1880s, some Oregon residents resented Chinese labor and believed that the immigration and settlement of Chinese communities in the Pacific Northwest hindered jobs available to Euro-Americans. As a result, Chinese immigrants experienced hostility, persecution, and discrimination. 5. In the early 1900s, Indians immigrated to Oregon as labors for the Pacific & Eastern Railroad Construction 6. After the attack on Pearl Harbor on December 7, 1941, anti-Japanese sentiment grew to an unprecedented height throughout the nation. On February 19, 1942, President Franklin D. Roosevelt signed Executive Order 9066 which forced citizens of Japan and Japanese American citizens living on the West Coast to leave their homes and relocate to internment camps.
During the 20th century, other Pacific Islanders and southeastern Asian people immigrated to Oregon. Never in the history of the United States have so many people come from the same region in so short a time under such dire circumstances as did the Southeast Asian refugees in the decade after 1975. 1. Filipinos arrived during the 1920s 2.Koreans came to Oregon in the 1950s 3. Thai, Lao, Hmong, Iu-Mien, Cambodian, and Vietnamese immigrated to Oregon throughout the 1970s. 4. Most of the Hills Tribe (Hmong,The Mien, The Kmhmu ) refugees came in the broad second wave of Southeast Asian resettlement in the early 1980s. 5. By 2000, in Oregon, there are 20,930 Chinese, 10,627 Filipinos, 12,131 Japanese, 12, 387 Koreans, 18,890 Vietnamese, 3,000 Laotians, and 7,976 Native Hawaiian and other Pacific Islanders. By 2006, the population of Asian American in Portland area is 6.7% (0.4 % are Pacific Islanders). Resource from the Oregon Historical Society
2009 "American Community Survey" census data on Asian-Americans Key Points • No. of self-reported Asians in Oregon: 137,749 (3.6% of population). • 41,846 attend school pre-k and up. • 64% are foreign born • 35% of people 5 years old and up speak English "less than well" • Per capita income $25,125 Source: 2009 selected population data from US Census * The individual populations of each ethnic group covered by the term "Asian" are too small to accurately convey survey data. Data Include Indian Asians, Pakistanis, Cambodians, Chinese, Japanese, Laotians, Vietnamese, Hmong, Thai, Bangladeshi, Korean, Filipino, Hawaiian and Pacific Islander.
Where do students of Asian/Pacific Islander descent go to school? http://www.ode.state.or.us/sfda/reports/r0067Select2.asphttp://www.clackesd.k12.or.us/about/maps/ESDsMapwithCountyNames.jpg
Portland Metro Area Students of Asian/Pacific Islander descent 2009/2010http://www.ode.state.or.us/sfda/reports/r0067Select2.asp http://www.portlandoctopus.com/portland-neighborhoods/
How does Oregon serve the Asian-American population? ORS 329.492 (1): "The department shall consult with theOregon Historical Society in the development of the academiccontent standards in Oregon Studies and in the preparation ofmaterials to support teacher training and classroom instructionin Oregon Studies. The materials shall include a balancedpresentation of the relevant contributions to society by men and women of African-American, Hispanic, Native American,Asian-American and other racial groups in Oregon." Source: the Oregon Educational Act, 2003
How does PPS serve the Asian American student population? According to the PPS website, the following schools offer either one-way (for native English speakers) or two-way (for non-native English speakers) immersion programs: Japanese K-5: Richmond 6-8: Mt. Tabor 9-12: Grant * Hosford is the only Mandarin immersion middle school in the country, according to Asian Reporter Mandarin K-5: Woodstock 6-8: Hosford IMS* 9-12: Cleveland
Other resources for Asian-American students in the Portland area: • The Baseline Essay series, developed by the ME/MC education program for PPS, details multiple aspects of culture and history of minority groups in Portland. Meant for teacher and students, by proxy affects student experience. http://www.pps.k12.or.us/depts-c/mc-me/essays-4.php • Asian-American Youth Conference: Held at a college campus in Portland, schools send "ambassadors" to attend the conference where there is a college fair and career fair
The Model MinoritySource: Goyette, Kimberly & Xie, Yu. "Educational Expectations of Asian American Youths: Determinants and Ethnic Differences. Sociology of Education. Vol. 72, No. 1 (Jan., 1999), 22-36. Avail: Jstore. - Asian American students score consistently higher on standardized tests...have higher GPA's, and attend four year colleges at higher rates than do white students. - Largely as a result of their higher educational achievement, the average family incomes of some Asian American groups surpass that of whites. - Educators sometimes assume their Asian-American students possess skills that in fact they do not. - Due to favorable socioeconomic and background characteristics, demonstrated academic ability, and parents' high expectations, Asian-Americans have been labeled the "model minority." http://www.8asians.com/wp-content/uploads/2007/08/time-asianamwhizkids.jpg
"Model Minority" Problems There is a large discrepancy between students from different areas that are still labeled as AIP. Many Eastern and Southern Asian American tend to perform higher than others, while Southeast Asians, Native Hawaiians, and Pacific Islanders generally perform well below average (Table below). Figure 9 shows that a significantly high proportion of AIP students (79%) speak a language other than English at home. http://www.nea.org/assets/docs/mf_asianfocus07.pdf http://professionals.collegeboard.com/profdownload/08-0608-AAPI.pdf
By the NumbersOther struggles of Asian American/Pacific Islander Students • 30% go to high poverty schools, compared to just 18% of white students. • Spanish is the most common language of students receiving ELL services but it is followed successively by Vietnamese, Hmong, Cantonese, and Korean. • Though Asian Americans score an average of 42 points higher on the SAT's than white students, they scored an average of 7 points lower in writing and 17 points lower in reading. • 19% attend schools that have weak promoting power (less than 50% of freshman advance to senior status in four years) compared to 11% of white students. • Asian Americans are more likely than white or black students to attend schools with high concentrations of students receiving ELL services. • In Oregon, 1 in 8 Asian/Pacific Islander children are born into poverty. http://www.all4ed.org/files/AsianPacific_FactSheet.pdf
What Can We Do? STICK TO THE BASICS OF GOOD EDUCATIONAL PRACTICES: • Get to know your students as individuals. What do they exceed in? What are their weaknesses? How do they learn best? • Don't make assumptions based on preconceived notions of ability.