Download
1 / 41
410 likes | 415 Views
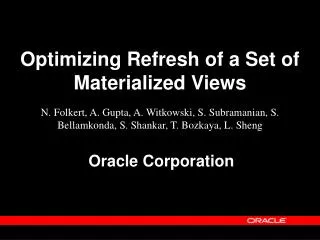
Optimizing Refresh of a Set of Materialized Views. N. Folkert, A. Gupta, A. Witkowski, S. Subramanian, S. Bellamkonda, S. Shankar, T. Bozkaya, L. Sheng. Oracle Corporation. Overview. Shapes of MVs for analysis: Rollup & Federated Cubes Improvements in refresh of a single MV

E N D
Optimizing Refresh of a Set of Materialized Views N. Folkert, A. Gupta, A. Witkowski, S. Subramanian, S. Bellamkonda, S. Shankar, T. Bozkaya, L. Sheng Oracle Corporation
Overview • Shapes of MVs for analysis: Rollup & Federated Cubes • Improvements in refresh of a single MV • Scheduling refresh of a set of MVs
Shapes of MV for Analysis • Queries • Ask for aggregations on different hierarchy levels • Rank, using window functions, within partitions • Rewrite a major performance tool • Hence, we need materialized views representing cubes • DW Maintenance of schema • Mostly partition based (add, drop, exchange, truncate) • Corrections done using DML touching few partitions • Hence, we need partition based refresh
Example – Hierachical Star Schema • Sales(city, day, amt) – fact table. Assume partition by time • Times(day, month, quart, year) – hierarchical dimension • Geog(city, state, region)- hierarchical dimension
ROLLUP CUBE • A grouping for each level, in each hierarchy • All groupings in a single MV • Easy to Manage • Variation where as many cubes as time attributes CREATE MATERIALIZED VIEW rollup_cube_MV AS SELECT t.year, t.quart, t.month, t.day, g.region, g.state, g.city, sum(s.amt) amt FROM sales s, geog g, times t WHERE t.day = s.day & g.city = t.city GROUP BY ROLLUP (t.year, t.quart, t.month, t.day) ROLLUP (g.region, g.state, g.city)
ROLLUP CUBE • A grouping for each level, in each hierarchy • All groupings in a single MV • Easy to Manage • Variation where as many cubes as time attributes CREATE MATERIALIZED VIEW year_rollup_cube_MV AS SELECT t.year, g.region, g.state, g.city, sum(s.amt) amt FROM sales s, geog g, times t WHERE t.day = s.day & g.city = t.city GROUP BY year, ROLLUP (g.region, g.state, g.city) CREATE MATERIALIZED VIEW quart_rollup_cube_MV AS SELECT t.quart, g.region, g.state, g.city, sum(s.amt) amt FROM sales s, geog g, times t WHERE t.day = s.day & g.city = t.city GROUP BY quart, ROLLUP (g.region, g.state, g.city)
Federated Cube • Each groupings in a separate MV • MVs with a time attribute candidates for partitioning • Flexibility of partitioning • Indexes smaller than ROLLUP CUBE (no NULL indexing) • Flexible “MV_size – query response” trade-off CREATE MATERIALIZED VIEW quart_state_MV AS PARTITION BY RANGE (quart) ( PARTITION VALUES LESS THEN ‘Q1 03’ PARTITION VALUES LESS THEN ‘Q2 03’…… ) SELECT t.quart, g.state, sum(s.amt) amt FROM sales s, geog g, times t WHERE t.day = s.day & g.city = t.city GROUP BY t.quart, g.state
Intuition for Partition refresh Sales PBY month on day … fact Apr 03 Oct 04 Jan 03 Feb 03 Mar 03 Nov 04 Dec 04 MV Q3 03 Q4 03 Q1 04 Q2 02 Q1 03 Q2 03 Q4 04 Q3 04 quart_state_MV PBY quart year_state_MV PBY quart MV 2003 2004
Intuition for Partition refresh - Drop Sales PBY month on day … fact Apr 03 Oct 04 Jan 03 Feb 03 Mar 03 Nov 04 Dec 04 MV Q3 03 Q4 03 Q1 04 Q2 02 Q1 03 Q2 03 Q4 04 Q3 04 quart_state_MV PBY quart year_state_MV PBY quart MV 2003 2004
Intuition for Partition refresh – Add Sales PBY month on day … fact Apr 03 Oct 04 Jan 05 Feb 03 Mar 03 Nov 04 Dec 04 MV Q3 03 Q4 03 Q1 04 Q2 02 Q1 03 Q2 03 Q4 04 Q3 04 quart_state_MV PBY quart year_state_MV PBY quart MV 2003 2004
Intuition for MV refresh – Maintain Sales PBY month on day … fact Apr 03 Oct 04 Jan 05 Feb 03 Mar 03 Nov 04 Dec 04 MV Q1 05 Q3 03 Q4 03 Q1 04 Q2 02 Q1 03 Q2 03 Q4 04 Q3 04 quart_state_MV PBY quart year_state_MV PBY quart MV 2005 2003 2004
Refresh Expressions • Conventional Refresh Expressions • Partition Based Refresh Expressions
Conventional Refresh – Use MV log • Maintenance Steps • Delete delta logged in MV log delta sale mv log … fact Jan 03 Feb 03 Mar 03 delta_sales s Q1 03 MV
Conventional Refresh – Use MV log • Maintenance Steps • Delete delta logged in MV log • Calculate aggregate on the delta delta sale mv log … fact Feb 03 Mar 03 (SELECT t.quart, g.state, sum(amt) amt FROM delta_sales s, geog g, times t WHERE s.day = t.day & s.city = g.city GROUP BY quart, state) delta Q1 03 MV
Conventional Refresh – Use MV log • Maintenance Steps • Delete delta logged in MV log • Calculate aggregate on the delta • Join MV with the delta MV • Update MV using delta MV delta sale mv log … fact Feb 03 Mar 03 UPDATE (SELECT m.quart, m.state, m.amt, delta.amt delta_amt FROM quart_state_MV m, (SELECT t.quart, g.state, sum(amt) amt FROM delta_sales s, geog g, times t WHERE s.day = t.day & s.city = g.city GBY..) delta WHERE m.quart = delta.quart & m.state=delta.state) SET amt = amt – delta_amt Q1 03 MV
Partition Change Tracking • The base fact table is partitioned • RDBMS keeps track of affected partitions • After partition operations (truncate, add, exchange, etc.) • After a DML (Insert, Delete, Update) to a partition • Can use instead of MV logs, but with high granularity … Apr 03 Oct 04 Jan 03 Feb 03 Mar 03 Nov 04 Dec 04 Truncate partition Single row delete
Partition Based Refresh • Fact table partitioned • MV partitioned • MV partitions determined by Fact partitions • Partition – join dependent columns in MV … CREATE MATERIALIZED VIEW quart_state_MV AS PARTITION BY RANGE (quart) ( PARTITION VALUES LESS THEN ‘Q1 03’ PARTITION VALUES LESS THEN ‘Q2 03’…… ) SELECT t.quart, g.state, sum(s.amt) amt FROM sales s, geog g, times t WHERE t.day = s.day & g.city = t.city GROUP BY quart, state fact Jan 03 Feb 03 Mar 03 Dec 04 … Q1 03 Q1 04 MV fact partition column mv partition column
Partition Based Refresh • Maintenance Steps • Determine Affected MV partitions 01-01-2003 01-02-2003 … (SELECT t.quart FROM times t WHERE t.day >= ’01-01-2003’ & t.day < ’02-01-2003’) fact Jan 03 Feb 03 Mar 03 Dec 04 Q1 03 Q1 04 MV
Partition Based Refresh • Maintenance Steps • Determine Affected MV partitions • Delete / Truncate the partitions … DELETE quart_state_MV WHERE quart IN (SELECT t.quart FROM times t WHERE t.day >= ’01-01-2003’ & t.day < ’02-01-2003’) fact Feb 03 Mar 03 Dec 04 Q1 04 MV
Partition Based Refresh • Maintenance Steps • Determine Affected MV partitions • Delete / Truncate the partitions • Insert recalculated partitions … INSERT INTO quart_state_MV SELECT t.quart, g.state, sum(s.amt) amt FROM sales s, geog g, times t WHERE t.day = s.day & g.city = t.city t.quart IN (SELECT t.quart FROM times t WHERE t.day >= ’01-01-2003’ & t.day < ’02-01-2003’) GROUP BY quart, state fact Feb 03 Mar 03 Dec 04 Q1 03 Q1 04 MV
Rewrite During Refresh INSERT INTO year_state_MV SELECT t.year, g.state, sum(s.amt) amt FROM sales s, geog g, times t WHERE t.day = s.day & g.city = t.city t.year IN (SELECT t.year FROM times t WHERE t.day >= ’01-01-2003’ & t.day < ’02-01-2003’) GROUP BY year, state … fact Jan 03 Feb 03 Dec 03 2004 2003 MV
Rewrite During Refresh INSERT INTO year_state_MV SELECT t.year, g.state, sum(s.amt) amt FROM sales s, geog g, times t WHERE t.day = s.day & g.city = t.city t.year IN (SELECT t.year FROM times t WHERE t.day >= ’01-01-2003’ & t.day < ’02-01-2003’) GROUP BY year, state … fact Jan 03 Feb 03 Dec 03 MV Q2 03 Q3 03 Q1 03 INSERT INTO year_state_MV SELECT t.year, mv.state, sum(mv.amt) amt FROM quart_state_mv, (SELECT DISTINCT quart, year FROM t) t WHERE mv.quart = t.quart mv.quart IN (SELECT t.quart FROM times t WHERE t.day >=’01-01-2003’ & t.day < ’02-01-2003’) GROUP BY year, state 2004 2003 MV
Efficiency of Partition Refresh • Truncate is very fast. No undo logs, just dictionary op • INSERT into an MV partition uses fast path with no logging, faster then conventional INSERT or UPDATE • Scan of a base partition may be more efficient than scan of MV logs (as they may have to keep more data) • If more than one partition of MV affected, we use MULTI-TABLE INSERT instead of multiple INSERTs. Scans the base data once • We use new optimization - Dynamic Partition Pruning • Generated refresh expressions automatically rewritten against already fresh MVs. Refresh expressions more suitable for rewrite.
Choosing Optimal Refresh Method • Partition Based Refresh may remove and recalculate more data in MV than conventional refresh • Cost based generation of refresh expressions • Conventional refresh expressions using MV logs • Partition Refresh with DELETE from MV • Partition Refresh with TRUNCATE of MV partition • Use Optimizer to estimate their cost and chose the cheapest method
Building Refresh Schedule • Usage of rewrite for schedule building • Resource allocation for concurrent execution of the schedule
Rewrite Schedule – Rewrite Graph • Build MV Dependency Graph • Nodes = Set of MVs to refresh year_region_mv day_region_mv quart_city_mv … month_city_mv day_state_mv day_city_mv
Rewrite Schedule – Rewrite Graph • Build MV Dependency Graph • Nodes = Set of MVs to refresh • Edges = Optimizer determined best rewrite for MV year_region_mv day_region_mv quart_city_mv … month_city_mv day_state_mv cost=10 day_city_mv
Rewrite Schedule – Rewrite Graph • Build MV Dependency Graph • Nodes = Set of MVs to refresh • Edges = Optimizer determined best rewrite for MV year_region_mv day_region_mv quart_city_mv … month_city_mv day_state_mv cost=10 cost=100 day_city_mv
Rewrite Schedule – Rewrite Graph • Build MV Dependency Graph • Nodes = Set of MVs to refresh • Edges = Optimizer determines best rewrite for MV year_region_mv day_region_mv quart_city_mv … cost=10 month_city_mv day_state_mv day_city_mv
Rewrite Schedule – Rewrite Graph • Build MV Dependency Graph • Nodes = Set of MVs to refresh • Edges = Optimizer determines best rewrite for MV • Result – acyclic graph with cost. (Cycles removed using SSC) year_region_mv day_region_mv quart_city_mv … cost=10 month_city_mv day_state_mv cost=40 cost=20 day_city_mv cost=100
Execution of Schedule - Resources • Assign resources (processes for now) to the graph • If cost > threshold, assign all processes to the refresh processors 6 cost=10 5 cost=10 4 cost=20 2 cost=40 3 cost=20 1 cost=100. (3) 1 1 1
Execution of Schedule - Resources • Assign resources (processes for now) to the graph • If cost > threshold, assign all processes to the refresh • Otherwise, assign processors proportionally based on cost processors 6 cost=10 5 cost=10 4 cost=20 2 cost=40. (2) 3 cost=20. (1) 2 2 3 1 cost=100. (3) 1 1 1
Execution of Schedule - Resources • Assign resources (processes for now) to the graph • If cost > threshold, assign all processes to the refresh • Otherwise, assign processors proportionally based on cost processors 6 cost=10 5 cost=10. (1) 4 4 5 4 cost=20. (2) 2 cost=40. (2) 3 cost=20. (1) 2 2 3 1 cost=100. (3) 1 1 1
Execution of Schedule - Resources • Assign resources (processes for now) to the graph • If cost > threshold, assign all processes to the refresh • Otherwise, assign processors proportionally based on cost processors 6 cost=10 5 cost=10. (1) 4 5 3 4 cost=20. (1) 2 cost=40. (2) 3 cost=20. (1) 2 2 3 1 cost=100. (3) 1 1 1
Execution of Schedule - Resources • Assign resources (processes for now) to the graph • If cost > threshold, assign all processes to the refresh • Otherwise, assign processors proportionally based on cost processors 6 cost=10 6 6 6 5 cost=10. (1) 4 4 5 4 cost=20. (2) 2 cost=40. (2) 3 cost=20. (1) 2 2 3 1 cost=100. (3) 1 1 1
Execution of Schedule - Others • Assign resources (processes for now) to the graph • How to get cost and thus schedule for refresh of empty MVs, • Use query defining the MV to get an estimate of its cost cost=10 cost=10 cost=20 cost=40 cost=20 cost=100
Performance • APB schema with 5.0 density • Fact with four hierarchical dimensions – 62 M rows • Dimensions (channel (2 levels), time (3), cust (3), prod (7)) • Federated full cube with 350 M rows • System 24 CPUs with total of 24 GB shared memory • Complete refresh • 6 times performance improvement over Oracle 9i • Incremental refresh – 1 month (3.5 M rows) added • 5 times performance improvement over Oracle 9i
Partition Based vs Conventional Refresh Incremental refresh time 400 350 Conventional 300 250 200 Partition Based with Delete 150 100 Partition Based with Truncate 50 Rows inserted 0 1000 2000 3000
Summary • Improvements in refresh of a single MV • Algorithms use partitioning of based tables and/or MVs • Costing of Multiple refresh methods using Optimizer • Dynamic Partition Pruning • MV rewrite during refresh • Scheduling refresh of a set of MVs • Usage of rewrite for schedule building • Resource allocation for concurrent execution of the schedule
Summary • MVs can be partitioned for more efficient refresh • Partition based refresh very suitable for cubes partitioned by time granules (good rewrites) • Federated cube offers good compromise size vs refresh & rewrite time if not too many groupings (less then 100) • Need better rewrite strategy for Federated cubes with many groupings (optimizer needs to do intelligent pruning of mvs)
Q & Q U E S T I O N S A N S W E R S A