Download
1 / 1
10 likes | 20 Views
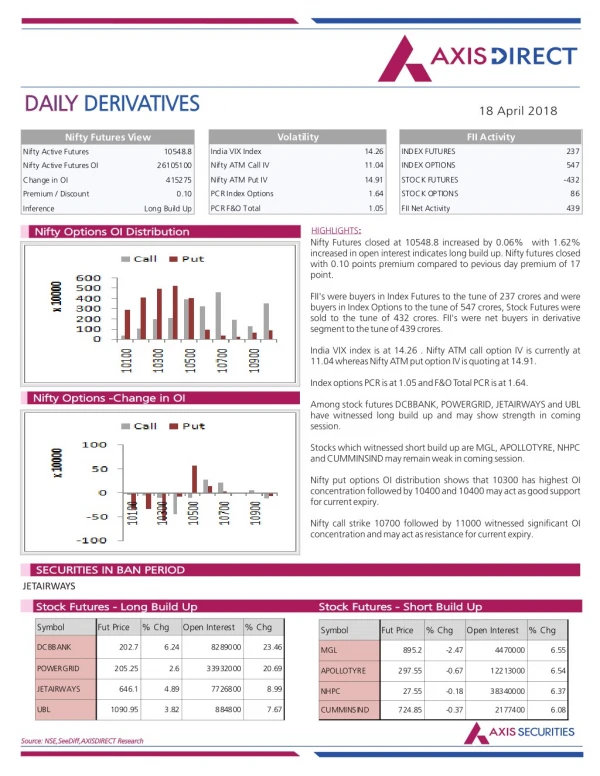
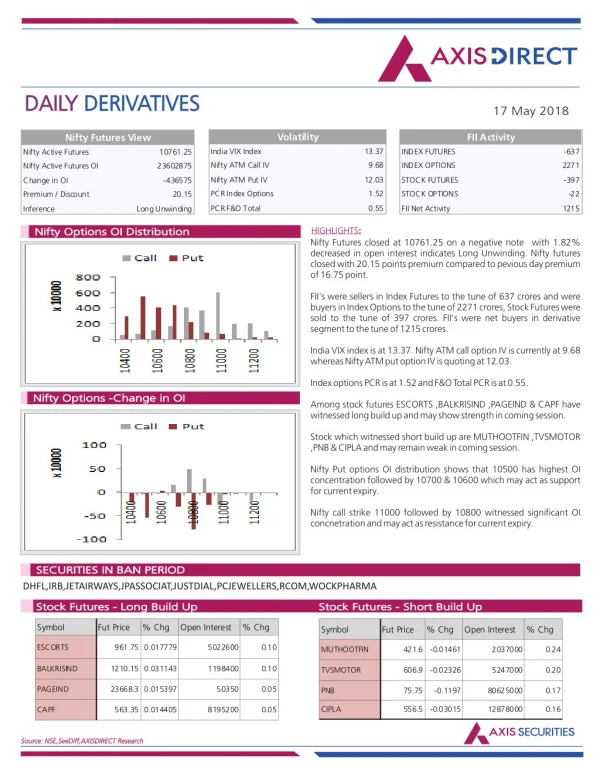
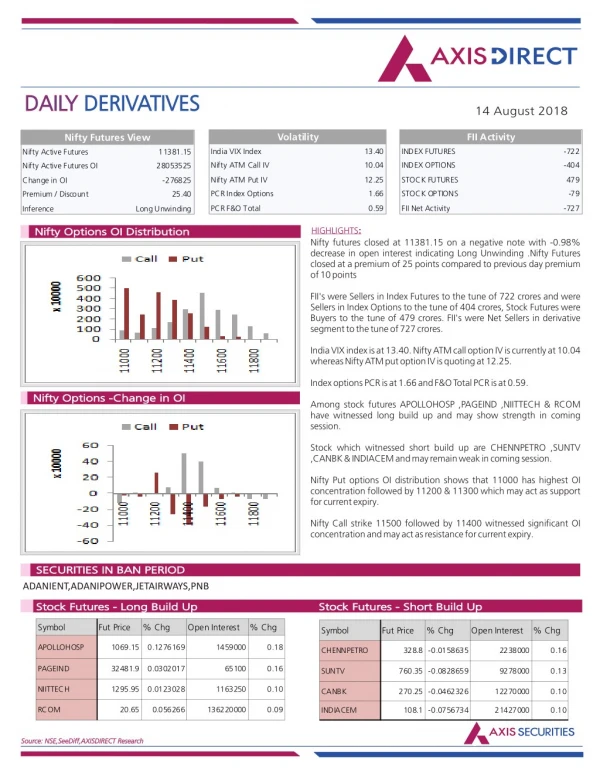
Axis Direct presents daily derivatives report presenting recommendations based on technical analysis. For trading in derivatives visit https://simplehai.axisdirect.in/offerings/products/derivatives<br>https://simplehai.axisdirect.in/share-stock-prices/nse/HDFC-Bank-Ltd-4987<br>

E N D
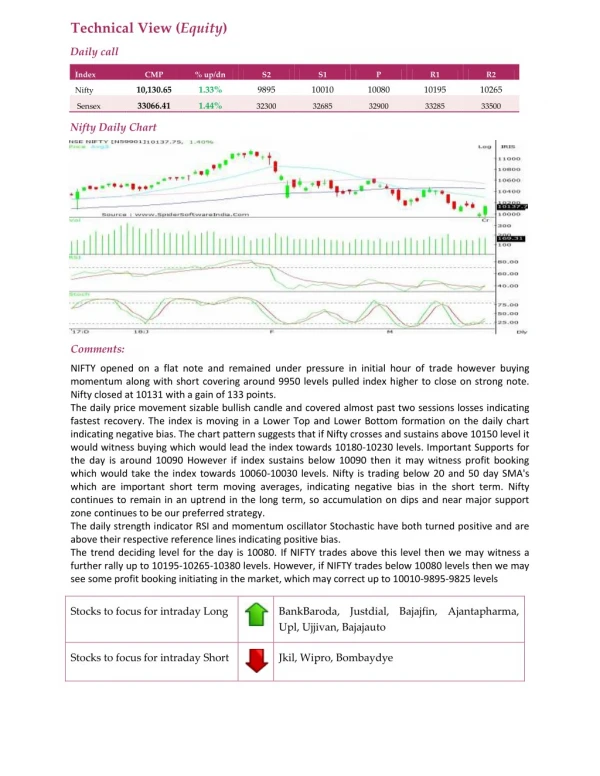
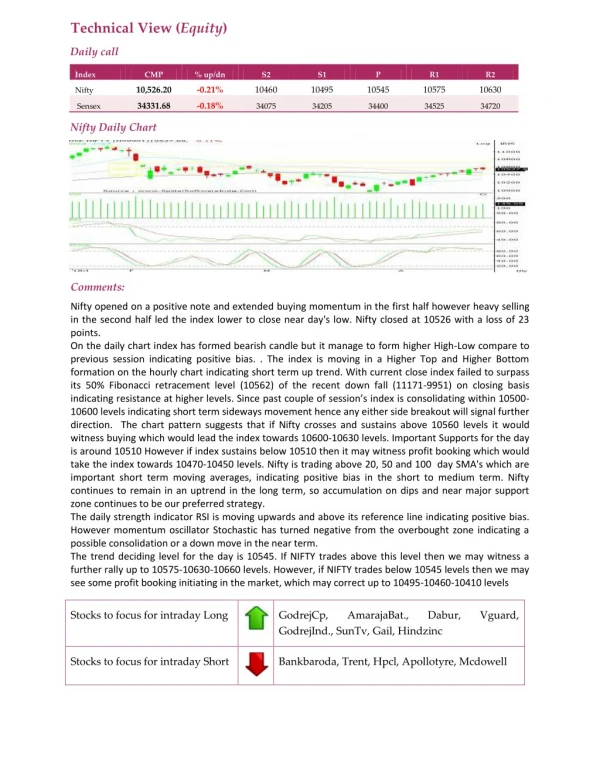
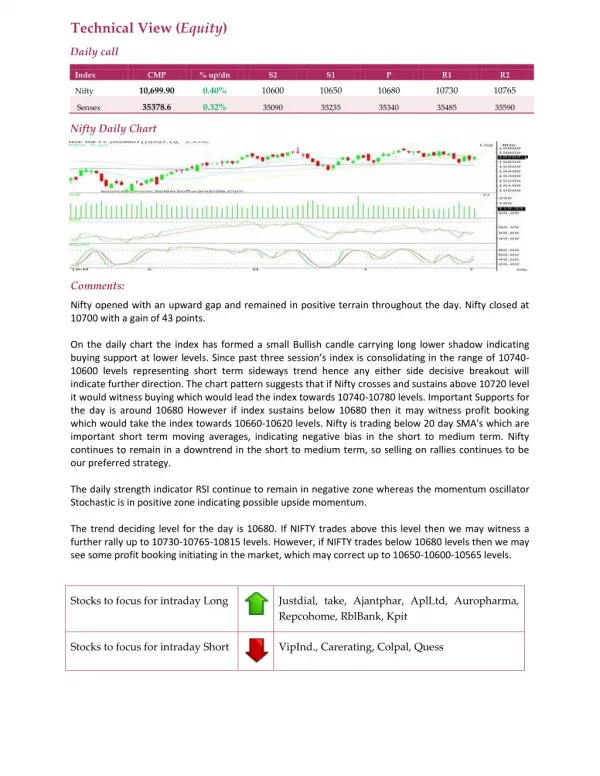
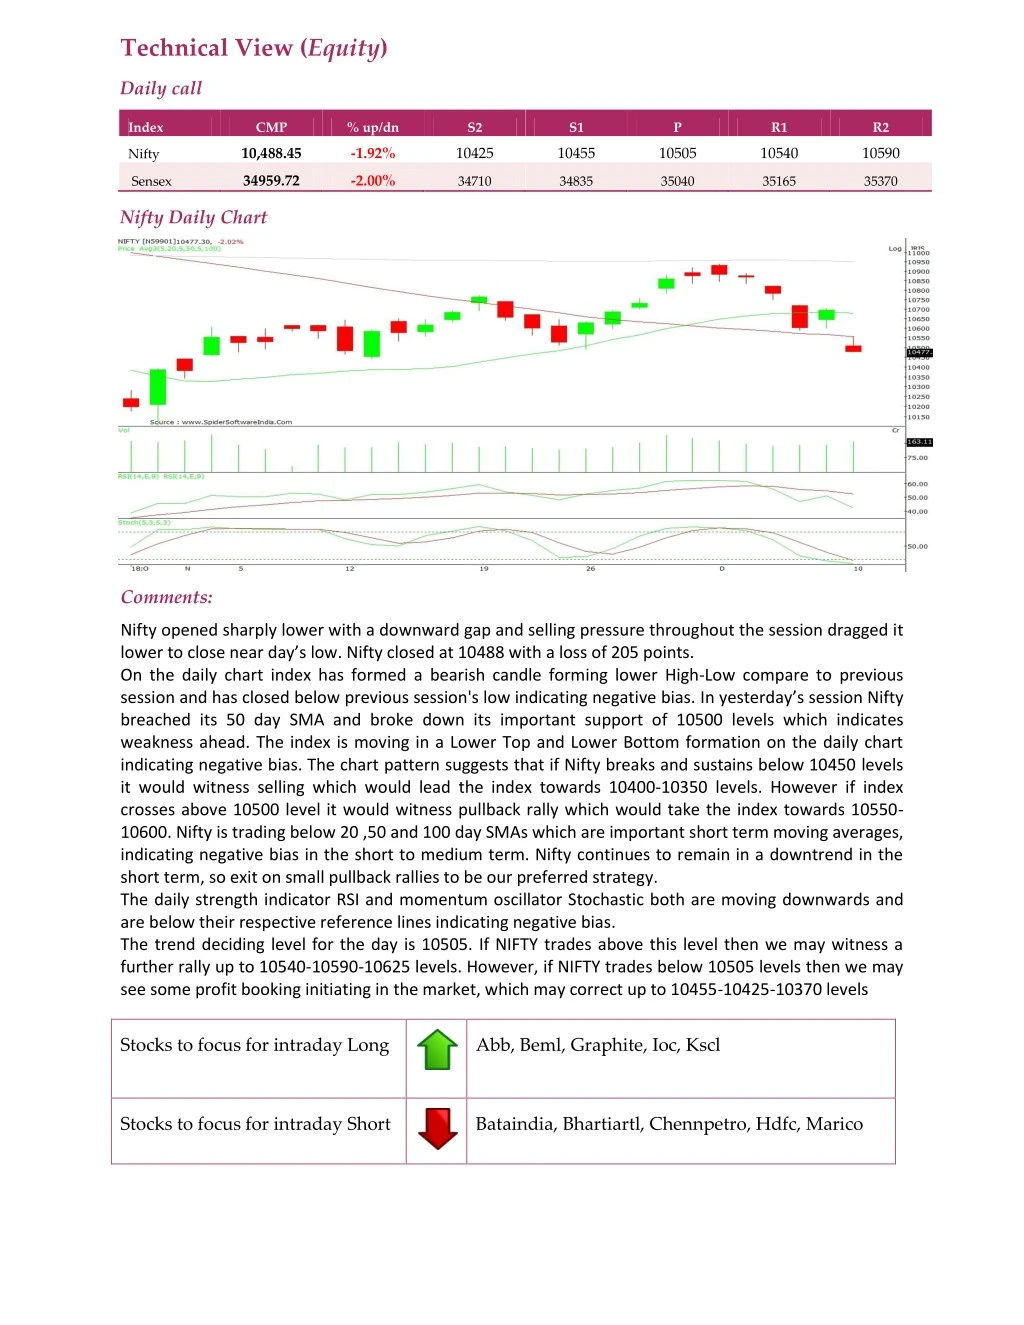
Technical View (Equity) Daily call Index CMP % up/dn S2 S1 P R1 R2 10,488.45 -1.92% 10425 10455 10505 10540 10590 Nifty 34959.72 -2.00% Sensex 34710 34835 35040 35165 35370 Nifty Daily Chart Comments: Nifty opened sharply lower with a downward gap and selling pressure throughout the session dragged it lower to close near day’s low. Nifty closed at 10488 with a loss of 205 points. On the daily chart index has formed a bearish candle forming lower High-Low compare to previous session and has closed below previous session's low indicating negative bias. In yesterday’s session Nifty breached its 50 day SMA and broke down its important support of 10500 levels which indicates weakness ahead. The index is moving in a Lower Top and Lower Bottom formation on the daily chart indicating negative bias. The chart pattern suggests that if Nifty breaks and sustains below 10450 levels it would witness selling which would lead the index towards 10400-10350 levels. However if index crosses above 10500 level it would witness pullback rally which would take the index towards 10550- 10600. Nifty is trading below 20 ,50 and 100 day SMAs which are important short term moving averages, indicating negative bias in the short to medium term. Nifty continues to remain in a downtrend in the short term, so exit on small pullback rallies to be our preferred strategy. The daily strength indicator RSI and momentum oscillator Stochastic both are moving downwards and are below their respective reference lines indicating negative bias. The trend deciding level for the day is 10505. If NIFTY trades above this level then we may witness a further rally up to 10540-10590-10625 levels. However, if NIFTY trades below 10505 levels then we may see some profit booking initiating in the market, which may correct up to 10455-10425-10370 levels Stocks to focus for intraday Long Abb, Beml, Graphite, Ioc, Kscl Stocks to focus for intraday Short Bataindia, Bhartiartl, Chennpetro, Hdfc, Marico