Download
1 / 1
10 likes | 22 Views
Axis Direct presents daily derivatives report presenting recommendations based on technical analysis. For trading in derivatives visit https://simplehai.axisdirect.in/offerings/products/derivatives

E N D
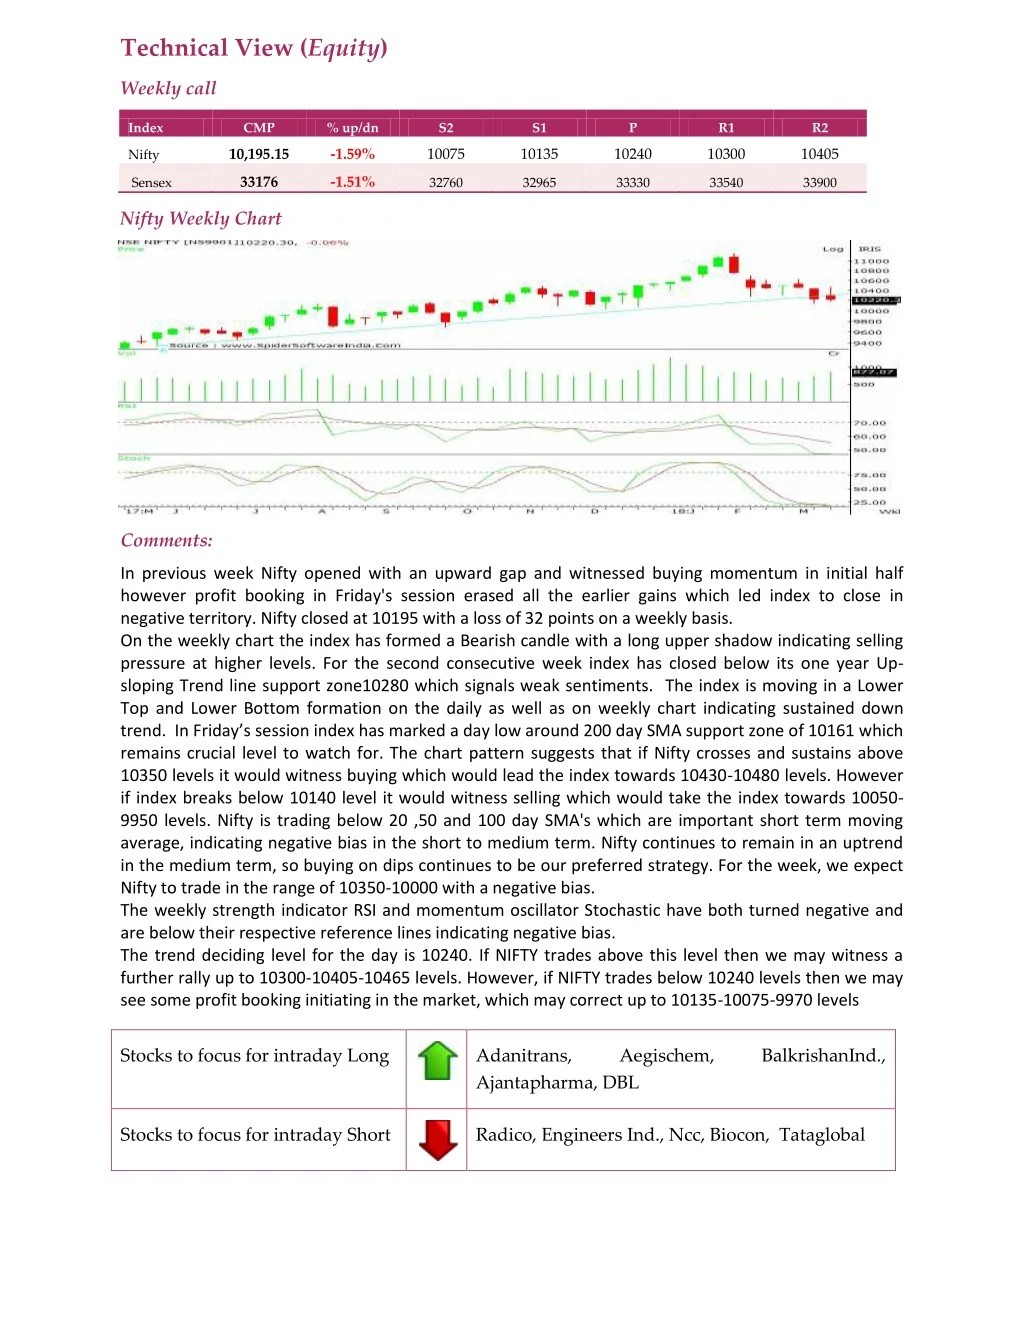
Technical View (Equity) Weekly call Index CMP % up/dn S2 S1 P R1 R2 10,195.15 -1.59% 10075 10135 10240 10300 10405 Nifty 33176 -1.51% Sensex 32760 32965 33330 33540 33900 Nifty Weekly Chart Comments: In previous week Nifty opened with an upward gap and witnessed buying momentum in initial half however profit booking in Friday's session erased all the earlier gains which led index to close in negative territory. Nifty closed at 10195 with a loss of 32 points on a weekly basis. On the weekly chart the index has formed a Bearish candle with a long upper shadow indicating selling pressure at higher levels. For the second consecutive week index has closed below its one year Up- sloping Trend line support zone10280 which signals weak sentiments. The index is moving in a Lower Top and Lower Bottom formation on the daily as well as on weekly chart indicating sustained down trend. In Friday’s session index has marked a day low around 200 day SMA support zone of 10161 which remains crucial level to watch for. The chart pattern suggests that if Nifty crosses and sustains above 10350 levels it would witness buying which would lead the index towards 10430-10480 levels. However if index breaks below 10140 level it would witness selling which would take the index towards 10050- 9950 levels. Nifty is trading below 20 ,50 and 100 day SMA's which are important short term moving average, indicating negative bias in the short to medium term. Nifty continues to remain in an uptrend in the medium term, so buying on dips continues to be our preferred strategy. For the week, we expect Nifty to trade in the range of 10350-10000 with a negative bias. The weekly strength indicator RSI and momentum oscillator Stochastic have both turned negative and are below their respective reference lines indicating negative bias. The trend deciding level for the day is 10240. If NIFTY trades above this level then we may witness a further rally up to 10300-10405-10465 levels. However, if NIFTY trades below 10240 levels then we may see some profit booking initiating in the market, which may correct up to 10135-10075-9970 levels Stocks to focus for intraday Long Adanitrans, Ajantapharma, DBL Aegischem, BalkrishanInd., Stocks to focus for intraday Short Radico, Engineers Ind., Ncc, Biocon, Tataglobal