Download
1 / 1
10 likes | 14 Views
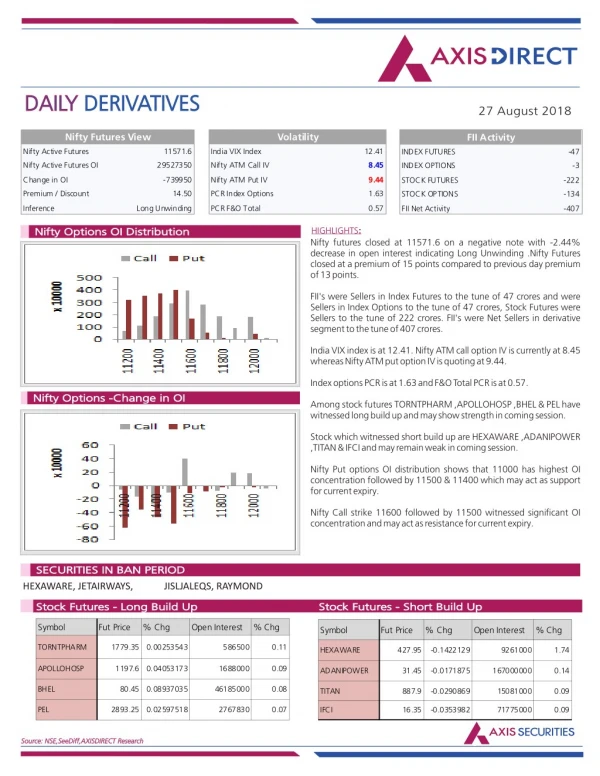
Axis Direct presents daily derivatives report presenting recommendations based on technical analysis. For trading in derivatives visit https://simplehai.axisdirect.in/offerings/products/derivatives<br>

E N D
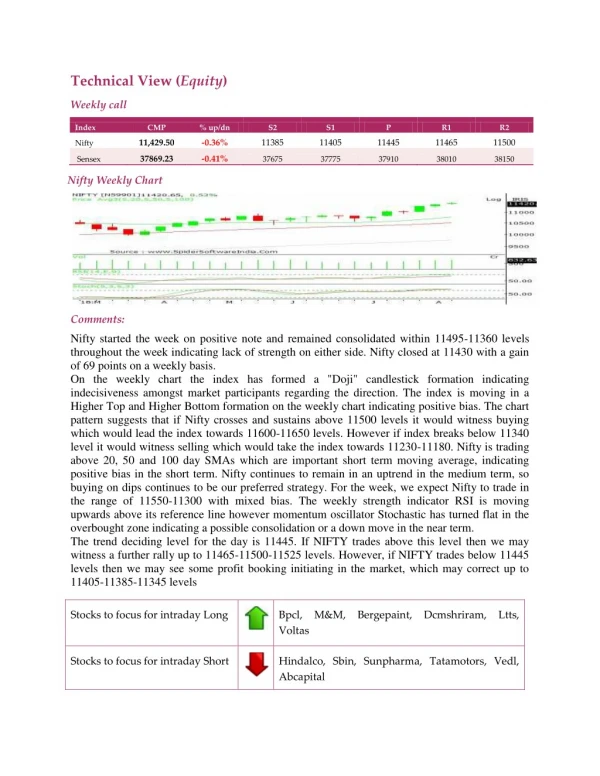
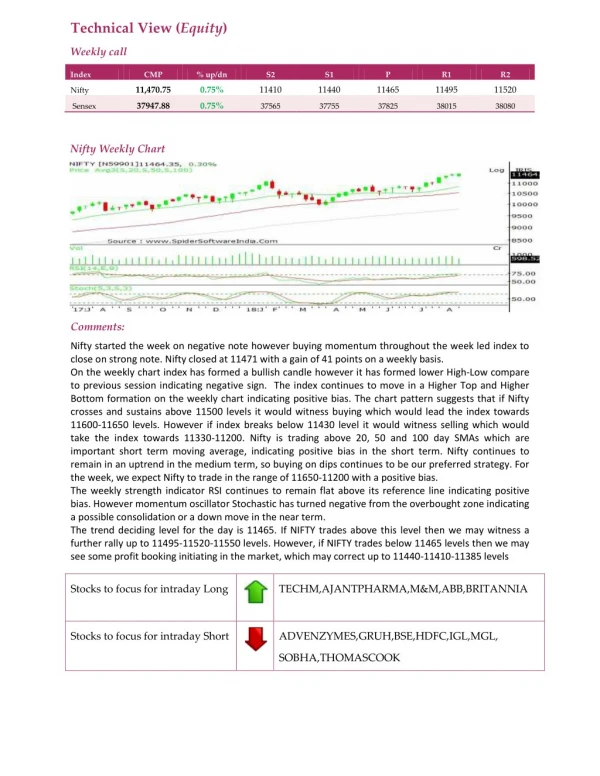
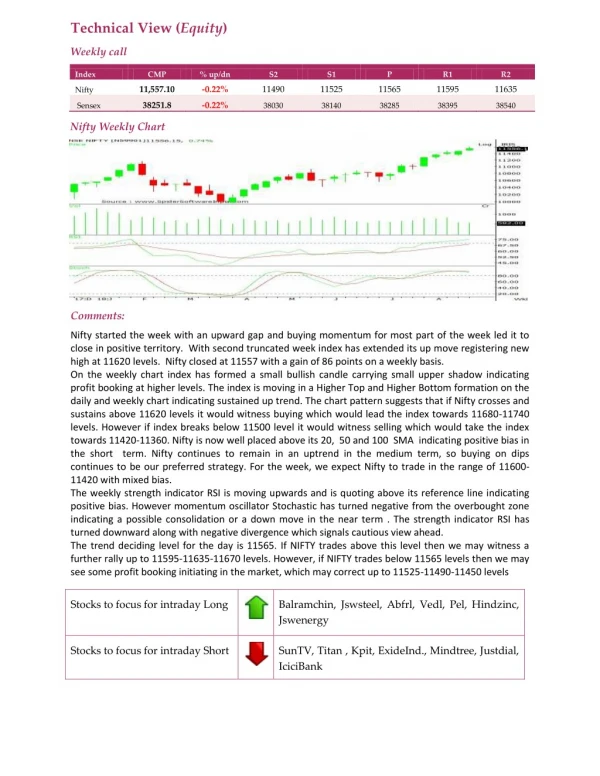
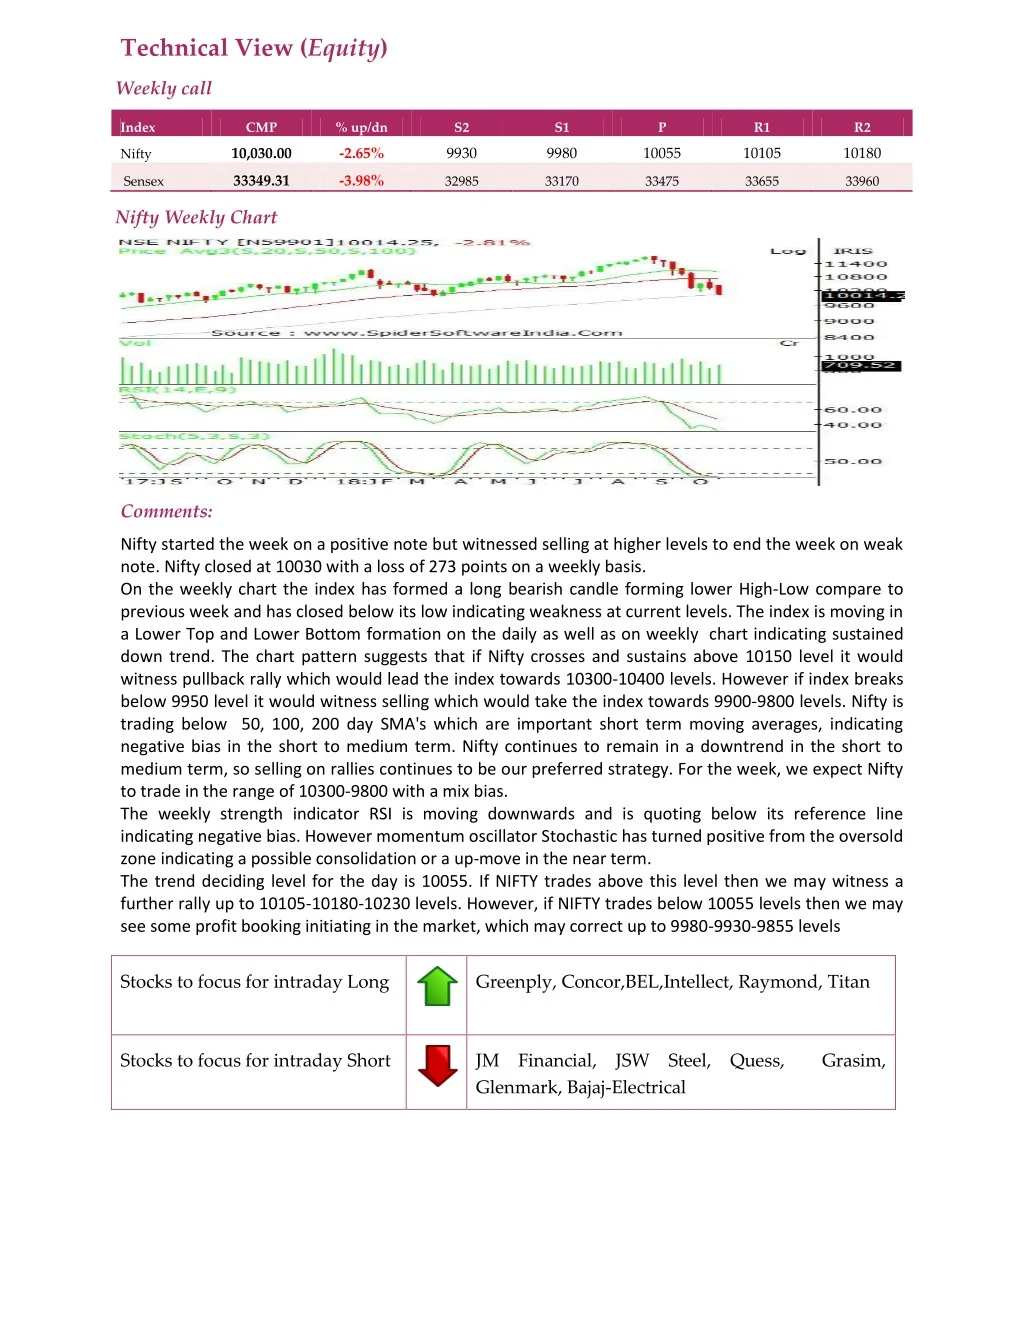
Technical View (Equity) Weekly call Index CMP % up/dn S2 S1 P R1 R2 10,030.00 -2.65% 9930 9980 10055 10105 10180 Nifty 33349.31 -3.98% Sensex 32985 33170 33475 33655 33960 Nifty Weekly Chart Comments: Nifty started the week on a positive note but witnessed selling at higher levels to end the week on weak note. Nifty closed at 10030 with a loss of 273 points on a weekly basis. On the weekly chart the index has formed a long bearish candle forming lower High-Low compare to previous week and has closed below its low indicating weakness at current levels. The index is moving in a Lower Top and Lower Bottom formation on the daily as well as on weekly chart indicating sustained down trend. The chart pattern suggests that if Nifty crosses and sustains above 10150 level it would witness pullback rally which would lead the index towards 10300-10400 levels. However if index breaks below 9950 level it would witness selling which would take the index towards 9900-9800 levels. Nifty is trading below 50, 100, 200 day SMA's which are important short term moving averages, indicating negative bias in the short to medium term. Nifty continues to remain in a downtrend in the short to medium term, so selling on rallies continues to be our preferred strategy. For the week, we expect Nifty to trade in the range of 10300-9800 with a mix bias. The weekly strength indicator RSI is moving downwards and is quoting below its reference line indicating negative bias. However momentum oscillator Stochastic has turned positive from the oversold zone indicating a possible consolidation or a up-move in the near term. The trend deciding level for the day is 10055. If NIFTY trades above this level then we may witness a further rally up to 10105-10180-10230 levels. However, if NIFTY trades below 10055 levels then we may see some profit booking initiating in the market, which may correct up to 9980-9930-9855 levels Stocks to focus for intraday Long Greenply, Concor,BEL,Intellect, Raymond, Titan Stocks to focus for intraday Short JM Financial, JSW Steel, Quess, Grasim, Glenmark, Bajaj-Electrical