Download
1 / 6
60 likes | 180 Views
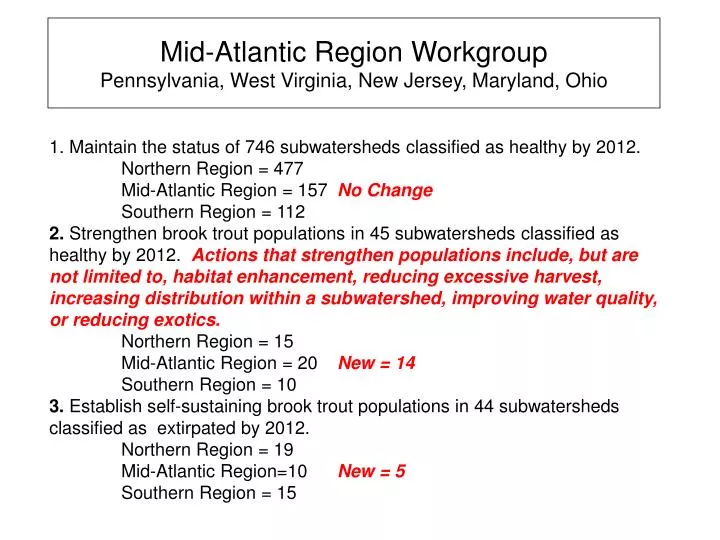
Mid-Atlantic Region Workgroup Pennsylvania, West Virginia, New Jersey, Maryland, Ohio. 1. Maintain the status of 746 subwatersheds classified as healthy by 2012. Northern Region = 477 Mid-Atlantic Region = 157 No Change Southern Region = 112

E N D
Mid-Atlantic Region WorkgroupPennsylvania, West Virginia, New Jersey, Maryland, Ohio 1. Maintain the status of 746 subwatersheds classified as healthy by 2012. Northern Region = 477 Mid-Atlantic Region = 157 No Change Southern Region = 112 2. Strengthen brook trout populations in 45 subwatersheds classified as healthy by 2012. Actions that strengthen populations include, but are not limited to, habitat enhancement, reducing excessive harvest, increasing distribution within a subwatershed, improving water quality, or reducing exotics. Northern Region = 15 Mid-Atlantic Region = 20 New = 14 Southern Region = 10 3. Establish self-sustaining brook trout populations in 44 subwatersheds classified as extirpated by 2012. Northern Region = 19 Mid-Atlantic Region=10 New = 5 Southern Region = 15
Mid-Atlantic Region WorkgroupPennsylvania, West Virginia, New Jersey, Maryland, Ohio 4. Improve 42 reduced subwatersheds to healthy classification by 2012. Northern Region = 15 Mid-Atlantic Region = 15 New = 4 Southern Region = 12 5. Strengthen brook trout populations in 90 subwatersheds classified as reduced by 2012. Actions that strengthen populations include, but are not limited to, habitat enhancement, reducing excessive harvest, increasing distribution within a subwatershed, improving water quality, or reducing exotics. Northern Region = 30 Mid-Atlantic Region = 30 New = 45 Southern Region = 30 6. Maintain 1,372 reduced subwatersheds in existing condition by 2012. Northern Region = 505 Mid-Atlantic Region = 678 No Change Southern Region = 189 7. Validate the predictive brook trout status model by assessing 50% of predicted subwatersheds by 2012. Northern Region = 700 Mid-Atlantic Region = 48 No Change Southern Region = 84
Mid-Atlantic Region WorkgroupPennsylvania, West Virginia, New Jersey, Maryland, Ohio Charges: 1) Develop annual action plans that address short-term Regional habitat objectives (identified as four groups – Habitat, Outreach, Research, Admin) 2) Develop accurate estimates of brook trout conservation costs at the state and Regional levels
Mid-Atlantic Region WorkgroupPennsylvania, West Virginia, New Jersey, Maryland, Ohio Habitat 13.8 million thru 2012 -Hire 4 contractual Biologists (250k/annually) = 1 million -National Forest habitat restoration (400k/annually) = 6.4 million -TU initiatives/partnerships (100k/annually) = 0.4 million -AMD/AML remediation (1.0, 1.0, 2.0, 2.0 million/annually) = 6 million
Mid-Atlantic Region WorkgroupPennsylvania, West Virginia, New Jersey, Maryland, Ohio Outreach 0.25 million thru 2012 -Hire Regional Outreach coordinator (60k/annually) = 240k Research 1.2 million thru 2012 -West Virginia (75k/annually) = 300k -Pennsylvania (75k/annually) = 300k -Maryland (75k/annually) = 300k -New Jersey (75k/annually) = 300k Administration 0.4 million thru 2012 - (100k/annually) = 400k
Mid-Atlantic Region WorkgroupPennsylvania, West Virginia, New Jersey, Maryland, Ohio Total Funding Needed thru 2012 = 15.64 million 2009 = 3.41 million 2010 = 3.41 million 2011 = 4.41 million 2012 = 4.41 million