Download
1 / 33
340 likes | 618 Views
Chapter 17 Federal Deficits, Surpluses, and the National Debt. Lecture Slides. Survey of Economics Irvin B. Tucker. What will I learn in this chapter?. How the budgetary process formulates and finances our national debt Why or why not worry over the national debt. 2.

E N D
Chapter 17Federal Deficits, Surpluses, and the National Debt Lecture Slides Survey of EconomicsIrvin B. Tucker
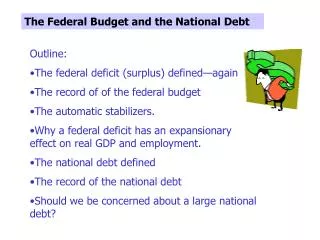
What will I learn in this chapter? How the budgetary process formulates and finances our national debt Why or why not worry over the national debt 2
What is thefederal fiscal year? October 1 through September 30
What is afederal surplus? The amount by which government tax collections government expenditures
What is thefederal deficit? The amount by which government expenditures exceed tax collections 6
Exhibit 17.2 U.S. Federal Budget Surpluses and Deficits, 1998-2010 236 128 125 69 -158 -162 Budget Surplus (+) or Deficit (-) (billions of dollars) -248 -318 -378 -413 -459 -1,293 -1,413 1998 1999 2000 2001 2002 2003 2004 2005 2006 2007 2008 2009 Year
What happened to the federal deficit in the late 1990s? Four years of federal surpluses from 1998 to 2001
Exhibit 17.3(a) Federal Expenditures and Tax Revenues as a Percentage of GDP, 1990-2010 26 25 24 Federal Expenditures 23 Federal expenditures and revenues as a percentage of GDP 22 21 20 Deficit Surplus 19 Deficit 18 17 Tax Revenues 16 15 1990 1995 20002005 2010 9 9 9 9 Year
What happened in 2001? Recession, tax cuts, and increased spending on the war on terrorism meant a return to deficits
Exhibit 17.3(b) Federal Budget Surpluses and Deficits as a Percentage of GDP,1990-2010 2 Surplus 0 Deficit Federal budget surplus or deficit as a percentage of GDP -2 Deficit -4 -6 -8 -10 -12 1990 1995 2000 2005 2010 Year 11
What is thenational debt? Amount owed by the federal government to owners of government securities
What is the net public debt? National debt minus all government interagency borrowing
How does the U.S. Treasury borrow money? By selling securities promising to make interest payments and to repay on a given date
What can be done to curb the national debt? Tax increase Spending caps Debt ceiling
What is a debt ceiling? The legislated legal limit on the national debt
What usually happens when the debt pushes against the ceiling? Congress raises the ceiling to accommodate the budget deficit
Exhibit 17.4 A Global Comparison of Government Surpluses and Deficits as a percentage of GDP, 2010 13% Federal surplus (+) or deficit (-) percent of GDP -3% -5% -6% -6% -8% -9% -9% -10% Norway Ireland France Canada United States Spain United Kingdom Greece Iceland Country 18
Why worry over the national debt? Can Uncle Sam go bankrupt? Are Americans passing the debt burden to their children? Does government borrowing crowd out private-sector spending?
Can the federal government go bankrupt? Yes, households and firms that continue to operate in the red go bankrupt No, federal government debt never must be paid off 20
Exhibit 17.5(a) The National Debt, 1930-2010 14 12 10 8 Trillions of dollars National Debt 6 4 2 0 2000 2010 1930 1950 1960 1990 1940 1970 1980 Year
Exhibit 17.5(b) National Debt as a Percentage GDP, 1930-2010 140 World War II 120 100 80 Percentage of GDP National Debt/GDP 60 40 20 0 2000 2010 1930 1950 1960 1990 1940 1970 1980 Year
Exhibit 17-6 A Global Comparison of National Debt Ratios, 2010 200% 127% National debt as a percent of GDP 107% 101% 93% 84% 82% 49% 25% Japan Italy Greece Belgium United States United Kingdom Sweden Canada Australia Country 23
Are we passing the debt burden to our children? Yes, interest payments to finance the national debt will swallow an enormous portion of the budget No, not as long as the bulk of the debt is internally owned
Exhibit 17.7 Federal Net Interest as a Percentage of GDP, 1940-2010 3.5 3.0 2.5 Net Interest as a Percentage of GDP 2.0 1.5 1.0 O.5 2010 2000 1960 1970 1990 1940 1950 1980 Year
Exhibit 17.8 Ownership of the National Debt, 2010 28% Private-Sector Debt Individuals, banks, corporations, and insurance companies 40% Public-Sector Debt Federal, state, and local governments and Federal Reserve banks Foreigners 32%
What is the internal national debt? The portion of the national debt owed to a nation’s own citizens
What is the external national debt? The portion of the national debt owed to foreign citizens
What is the crowding-out effect? When federal government borrowing increases interest rates, the result is lower consumption and investments, which decreases the AD curve
Does government borrowing crowd out private-sector spending? Yes, the more the government borrows the less loanable funds for everyone else No, especially if it occurs during economic downturns
AD and real GDP increase dampened Consumers and businessspending decrease Interest rates rise Govt. competes with private borrowers Govt. spends and borrows
Exhibit 17.8 Zero, Partial, and Complete Crowding Out AS E2 215 E2 Price level(CPI) E1 210 AD2 (zero) AD2 (partial) AD1 (complete) Full employment 13 0 13.5 14 Real GDP 32 32 (trillions of dollars per year)