Download
1 / 67
670 likes | 785 Views
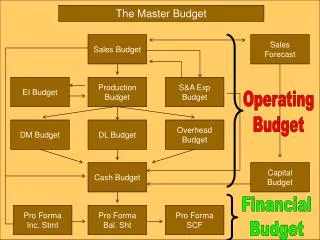
2010/11 Adopted Budget Development Report. Board Meeting June 1, 2010. Y: Business Services/Budget/2010-11/Adopted/ Meetings/B6-01-10. Executive Summary. The State’s financial situation continues to look grim A slow revenue recovery is not helping

E N D
2010/11 Adopted Budget Development Report Board Meeting June 1, 2010 Y: Business Services/Budget/2010-11/Adopted/ Meetings/B6-01-10
Executive Summary • The State’s financial situation continues to look grim • A slow revenue recovery is not helping • Under the proposals provided by the Governor, as part of his May revisions, the District stands to lose another $1.2 million • To cover the estimated budget shortfall the District plans to use a number of strategies to place a balanced budget before the Board for approval on June 15: • Sweep Tier III resources as permitted by the State • Incorporate negotiated agreements and Board imposed employee compensation changes • Reduce operating expenditures • Use existing reserves • Reduce positions reflected in this report
Table of Contents SECTION DESCRIPTION PAGE # • Introduction • View From the State • Funding for the District • Other Issues • Updating the Problem for 2010/11 • Proposal for Closing the Budget Gap • Categorical Funding Goals • Recommendations & Discussion • Appendix 1 1 - 2 1 - 4 1 - 4 1 - 12 1 - 3 1 - 3 1 i
Introduction to the May Revision • The May Revision is, by statute, the Governor’s last chance to provide his Budget proposals to the Legislature • Overall, the State Budget situation has gotten worse • Inaction by the Legislature has caused planned savings to slip away • Revenues are still falling below the state’s already low forecasts • In the May revision, education continues to be better protected than other programs A1
The View From the State Section B B
May Revision Features • The May Revision contains one additional cut to K-12 education • Cuts proposed in January still remain • Targeted proposed administrative cuts were eliminated • Major additional cuts to the non-education portions of the Budget are proposed • We can expect the Legislature to have great difficulty voting for the choices before them • The Governor dropped the targeted nature of proposed cuts, allowing broad local discretion in how the cut will be implemented • One change will cost Lodi USD more than $1 million • How it’s implemented will dictate the actual amount B1
Risks to the Revised Budget Proposal • The May Revision, if enacted as proposed, contains significant risks • Court challenges – rebenching Proposition 98, elimination of CalWORKs, state worker pay cuts, health care reductions, and other cuts could face court challenges • Late Budget – a late Budget would delay implementation of program reductions, resulting in the loss of budgeted savings • Economic and revenue risks – the state and national economies face the possibility of a “double dip” recession, especially in light of the turmoil in overseas economies • These risks in turn could threaten California’s access to the capital markets, pushing borrowing costs even higher B2
Funding For the District Section C C
Revenue Limit Funding • Base Revenue Limit (BRL) funding under the May Revision would receive the following adjustments: • Funding for growth and a “fully funded” statutory Cost of Living Adjustment (COLA) of -0.39%, essentially unchanged from the -0.38% estimate in January • No change in the deficit factor from the Governor’s January Budget Proposal • 18.355% for K-12 school districts • The flat rate funding reduction to the Revenue Limit has increased from the $201 reported in January • This reduction will be about $244 per ADA and cost Lodi USD more than $1 million • Department of Finance (DOF) is considering a 3.85% reduction to each district’s undeficited BRL in place of the specific amount per ADA by district type C1
Revenue Limit Deficit 2008/09 2009/10 2010/11 May Revise Or $244 C2
K-12 Revenue Limits Cola (.38%) Cola (.39%) 18.355% 18.355% 18.355% 2009-10 Fiscal Year $655,464 $697,928 COLA Deficit Deficit Deficit $1,185,024 2009/10 Adopted Governor’s Jan. Proposal For 2010/11 Governor’s May Proposal For 2010/11 C3
Special Education • The May Revision provides a fully funded negative COLA of -0.38% for special education (AB 602) on the state share of funding • Growth is funded at or $463.67 per ADA • There are several proposed adjustments for 2010-11, including: • $634 million decrease in one-time American Recovery and Reinvestment Act (ARRA) funding • Funding remains in the May Revision for the Behavior Intervention Plans on the mandate settlement • Will add approximately $10.92 per ADA to AB 602 base • However, legislative action is required before funding will occur C4
Other Issues Section D D
Aug 10 April 10 Mar 09 Feb 10 Jan 10 Jan 10 Sept 10 Sept 10 Dec 10 Aug 10 Nov 10 Oct 10 Jan 10 Jun 10 May 10 April 10 Aug 10 March 10 Aug 10 Feb 10 July 10 Dec 09 State Delays Paying Schools 2010/11 Cash Flow July 10 D1
Employee Retirement Contribution Rates • State Teachers Retirement System (STRS) has an unfunded liability in the billions • We should expect to see an increase in the employer contribution rates in the future • Increasing the employer contribution rate does require legislation • Public Employees Retirement System (PERS), also, has an unfunded liability in the billions D2
SERP – Sample Break Even 77 as of May 27th 60 40 20 District must spend money to purchase insurance annuity D3
Unemployment Insurance Rates • School Employees Fund (SEF) contribution rates, which are based upon a percentage of total wages paid, will more than double in 2010-11, from the current 0.30% to 0.72% • This is a reflection, at least in part, of increased layoffs • In addition to the uniform contribution rate increase, employers that have increased layoffs will see an increase in their local experience charge (LEC) that lags the layoffs • The LEC is based on data for the fiscal year that began 24 months prior to the fiscal year for which the rate is being calculated • School districts will receive a corresponding increase in their revenue limit income, pursuant to E. C. 42241.7 D4
Updating the Problemfor 2010/11 Section E E
Where We’ve Come? The Board & public were formally briefed about the structural balancing problem at the October 6, 2009, Board meeting Negotiations with the bargaining groups began on November 19, with a clearly defined target SBAC gave recommendations to the Superintendent on December 2, 2009 Those recommendations were sent to the Board, all employees and have been published on the District web site since December 2009 A problem model reflecting the Governor’s budget proposals for 2010/11 was presented to the Board on January 26, 2010 Negotiated / Imposed concessions with Confidential, L.P.P.A., L.U.S.D.A.A. and Supervisors have been approved by the Board We’re now presenting the changes proposed by the Governor on May 14, 2010 The Board will be asked to adopt a budget for 2010/11 on June 15 The process won’t be over until the State adopts its budget and we make final adjustments E1
Enrollment Projections 2009/10 CBEDS PROJECTED STUDENTS CHANGE ADA PROGRAMS 15,172 1. Regular K-6 15,023 (149) (141) 2. Regular 7-8 4,222 4,185 (37) (34) 3. Regular 9-12 7,862 7,763 (99) (91) 4. All Other Programs 2,138 2,138 - - 5. Serna Charter School 290 290 - - 6. Total K-12 Increases 29,684 29,399 (285) (266) Enrollment is projected to continue declining E2 Rio Valley Charter is not expected to have an impact
Summary of Growth Expenses DESCRIPTION F.T.E BUDGET 1. Teacher Staffing (11.12) ($696,553) 2. Special Ed. Staffing (Cert. & Class.) 3. Custodial Support & Bus Drivers 4. Site Clerical, Noon Duty & Campus Supv. 5. Per-Pupil Allocations (18,911) 6. Total Growth Expenses ($715,464) (11.12) There is more declining enrollment projected for 2010/11 E3
Mandatory On-Going Expenses 4. Aspire Special Education-Stockton/Oakland 165,547 5. Elect., Gas, Heat, Disposal & Sewage 210,541 6. Phone & Wide Area Network Services (101,733) 7. Technology Maint. Agree. & New Systems n/c 8. Total Mandatory On-Going Expenses $2,666,300 Descriptions F.T.E BUDGET 1. Projected Step & Column Costs $2,082,410 2. Health & Welfare - Retiree 145,721 3. Worker’s Compensation - .25% Increase 163,814 E4
Mandatory One-Time Expenses 1. Contingency Reserve – Replenish 2. General Reserve Requirement (3%) $104,195 41,763 -0- 3. Total Mandatory One-Time Expenses $145,958 Descriptions F.T.E BUDGET E5
Other On-Going Expenses 2. Tier III 1. Categorical Programs that Encroach 2,334,011 $940,049 3. Federal ARRA Expenses 6,279,706 4. Total Other On-Going Expenses $9,553,766 Descriptions F.T.E BUDGET (*) (*) Use of these funds to retain staff was supported by employee groups, management and the Board E6
Other One-Time Expenses 1. General Reserve Requirement (3%) $ 286,613 -0- 2. Total Other One-Time Expenses $ 286,613 Descriptions F.T.E BUDGET E7
Summary of Increased Costs E. Additional Other One-Time Costs D. Additional Other On-Going Costs C. Increased Mandatory One-Time Costs 9,553,766 286,613 145,958 B. Increased Mandatory On-Going Costs 2,666,300 (11.12) A. Growth Costs ($ 715,464) F.Total Estimated Uses (11.12) $11,937,173 Description F.T.E Budget E8
Estimate of Growth IncomeFewer Students Equals Less Income F.Total Estimated New Income ($1,605,896) Description Budget A. Net Growth Income ($1,378,393) B. Special Education Growth (123,336) C. Class-Size Reduction – Grades K-3 (74,907) D. Interest Income E. Lottery Income (29,260) There is declining enrollment projected for 2010/11 E9
Other Funding Sources ($ 682,775) 1. Revenue Limit COLA (-.39%) ($ 682,775) (6,674,535) 2. Revenue Limit Reduction (-3.85% or -$244) (6,674,535) (113,166) (113,166) 3. Other Program COLAs (-.38%) 1,747,112 5. A.R.R.A. – IDEA Carryover (est.) 1,747,112 4. A.R.R.A. – Title I Carryover (est.) 588,337 $ 588,337 6. Reduce 3% General Reserve 969,589 969,589 7. Total Funding Sources ($7,470,476) ($4,165,438) $3,305,038 ONE- TIME ON- GOING Descriptions TOTAL E10
Defining “Now” the Problem One Time On Going Description Total A. Structural Balancing (Prior) ($13,641,534) ($13,641,534) B. Funding Sources (1,605,896) (1,605,896) C. Estimated Uses ($ 432,571) (11,504,602) (11,937,173) D. Other Sources (7,470,476) 3,305,038 (4,165,438) E. Total Problem $2,872,467 ($34,222,508) ($31,350,041) E11
Defining “Future” the Problem 2011/12 2012/13 F.T.E Budget F.T.E Budget Description ($ 235,955) ($ 7,790,114) A. Structural Balancing $2,266,111 2,520,431 B. Cost of Doing Business C. Projected Budget Reductions ($ 10,056,225) (2,756,386) (155.05) (43.49) D. Revenue Sources 0 0 E. Total Problem $0 $0 (155.05) (43.49) E12
Proposals for Closing the Budget Gap Section F F
Summary of the ProposalUnrestricted Program Only Sweeps from Tier III Programs $5,357,399 • L.E.A. 260.17 12,074,479 • C.S.E.A. 124.27 5,885,553 • Bargaining Agreements/Imposed 12.90 3,575,210 • Reserves Set Aside for 2010/11 1,713,634 • Prior Year ADA 1,000,000 • Operating Expenses (Transportation & Others) 645,407 • Capital Outlay Reserves 543,359 • Declare 2009/10 Ending Fund Balance 325,000 • ARRA Construction @ Needham West 230,000 • T0TAL ADJUSTMENTS $31,350,041 397.34 Description FTE Amount F2
Categorical Funding GoalsFor the 2010/11 Adopted Budget Section G G
Eliminated Positions That Can Be Restored With Categorical Resources * * * * (*) Funding resource has been changed to Restricted G2
Recommendations & Next Stepsto move towards the 2010/11 Adopted Budget Section H H
Recommendations • Recognize the decline of enrollment projected for 2010/11 • This decline is less than the past two years • Recognize the impact of the Governor’s May revisions on the budget for Lodi USD • Recognize the budget gap is $31,350,041 • Recognize that with the proposed balancing solutions, the structural out of balance will remain $7,790,114 going into next year • Approve the categorical goals strategy • Approve the budget balancing strategy H1
Appendix • Details of Superintendent Recommendations • Categorical Program Goals • Superintendent’s Budget Advisory Committee Recommendations • Routine Restricted Maintenance • Flexibility Opportunities Continue • Chart School Funding • Acronyms
Resources One Time On Going Description Total A. Tier III Sweeps $5,357,399 $5,212,092 $ 145,307 B. Ending Balance Reserves 1,713,634 1,713,634 C. Prior Year ADA 1,000,000 1,000,000 D. Capital Outlay Reserves 543,359 543,359 • Estimated Ending Bal. 325,000 325,000 F. Total Resources $3,727,300 $5,212,092 $8,939,392 I-1
Reduce Expenditures FTE One Time On Going Description Total A. LEA ($12,074,479) ($12,074,479) (260.17) * B. CSEA (5,885,553) (5,885,553) (124.27) ($960,347) C. Negotiations (2,614,863) (3,575,210) (12.90) * D. Other Expenses (645,407) (645,407) E. ARRA Construction (230,000) (230,000) F. Total Problem (397.34) ($1,190,347) ($21,220,302) ($22,410,649) (*) Includes major reductions in Transportation Services 2
Balancing One Time On Going Description Total A. The Problem ($31,350,041) ($34,222,508) $2,872,467 B.Proposed 1. Resources 3,727,300 5,212,092 8,939,392 2. Expenses (21,220,302) (1,190,347) (22,410,649) C. Total $7,790,114 ($7,790,114) $ 0 I-3
Resources – Tier III Sweeps The State does allow Districts to move funds from some categorical programs to help address the budget crisis No. DESCRIPTION EXPLANATION One-Time On-Going Total I-4
Savings Achieved ThroughAgreements & Board Imposed Changes with Employee Groups Additional details in slide I-10 and I-11 I-5
CSEA Reductions No. DESCRIPTION EXPLANATION On-Going Total @ @ @ @ I-6 (@) Partially retained with categorical resources
CSEA Reductions * * * * * * (*) Retained with categorical resources I-7
Other Reductions I-9