Download
1 / 53
530 likes | 682 Views
ICRF Group. Emission in the range of Ion Cyclotron Frequencies on ASDEX-Upgrade. R. D’Inca – September 2009. Seminar talk – Advanced plasma courses - IPP. Outline. 1 – Motivation -> 2 - Experimental setup -> 3 - Experimental results on ASDEX-Upgrade ->

E N D
ICRF Group Emission in the range of Ion Cyclotron Frequencies on ASDEX-Upgrade R. D’Inca – September 2009 Seminar talk – Advanced plasma courses - IPP
Outline 1 – Motivation -> 2 - Experimental setup -> 3 - Experimental results on ASDEX-Upgrade -> 4 - Overview and interpretation of ICE theories -> 5 - Next steps ->
1 - Motivation Back to outline
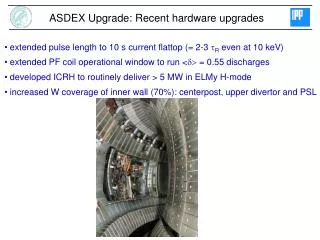
1 – Motivation ICRF System ASDEX Upgrade and arc detectors
2 – Experimental setup Back to outline
2 – Experimental setup (1/2) • Two diagnostics are used: • RF probe in HFS of vacuum vessel, sector 13. (access provided by. M. K-H Schuhbeck) • Voltage probe in transmission line of ICRF Antenna 4 Side-view Upper-view Main limitation: the main characteristics of the RF probe are not known (attenuation factor, bandwidth, cut-off frequencies).
2 – Experimental setup (2/2) Signal processing system based on two Acqiris DC265 digitizing cards (8 bits, 500MS/s, 2MB memory/channel, 4x channels). Signal acquisition process Tunable reject filter centered on ICRF generator freq. Low noise preamplifier +30dB Sun workstation Acqiris rack Antialiasing filter 60Mhz+ RF probe Raw RF signal Digital processingFFT Increase SNR and resolution limited by 8bits cards Remove higher ICRF harmonics and other high frequencies Digitizing Remove main ICRF generator frequencyIncrease SNR We want to observe the evolution of the frequencies during the whole shot Specific method for triggering 10ms: effect on time resolution The solution chosen is a compromise between the resolution in frequency and the resolution in time Generates TTL signal:Trigger Digitizing Signal to digitize Time Digital Controller AcqirisCard 1500points 10ms X 700 ≈1MB must be < Acqiris memory size Effect on FFT resolution 700 pulses
3 – Experimental results Back to outline
3 – Experimental results We observe three different types of signals in different conditions: a) Ion Cyclotron Emission at the plasma edge during NBI heating b) Ion Cyclotron Emission at the plasma edge during ICRF heating c) Ion Cyclotron Emission at the plasma center during NBI heating
3 – Experimental results We observe three different types of signals in different conditions: a) Ion Cyclotron emission at the plasma edge during NBI heating b) Ion Cyclotron emission at the plasma edge during ICRF heating c) Ion Cyclotron emission at the plasma center during NBI heating
3 – Experimental results a) Ion Cyclotron Emission from the plasma edge with NBI (MW) +NI4 +NI8 +NI5 +NI1 NI3 Radiated power (s)
3 – Experimental results a) Ion Cyclotron Emission from the plasma edge with NBI • We have a good correlation between the FFT of the signal and the theoretical ion cyclotron frequency of Deuterium (or alpha) and He3 in the midplane, 2cm outside the separatrix (r≈2.15m). • No first harmonic present • 2nd and 4th D-harmonics more intense • Presence of the signature of a fusion product (He3) in the signal. • No fine structure detected (but limitation of resolution) • intermittence in the signal 4nd harmonic He3 5th harmonic D 4rd D/3rd He3 3rd harmonic D 2nd harmonic He3 2nd harmonic D (MW) +NI4 +NI8 +NI5 +NI1 NI3 Radiated power (s)
3 – Experimental results a) Ion Cyclotron Emission from the plasma edge with NBI Conditions of existence Such signal detected only for for three shots (but not all the shots with NI were studied): • Relatively low magnetic field and current • High level of power (>8MW) • H-mode with type I ELMs • Neutral flux > 4.1014
3 – Experimental results a) Ion Cyclotron Emission from the plasma edge with NBI Correlation with MHD activity • Interruption of ICE signal correlated with „Giant“ ELM (type I). • MHD modes detected during ICE signal, interruption also correlated with ELM. • Neutron rate affected by ELM: fusion reaction rate decrease during ELM (whole plasma affected by the loss of confinement). • Correct sequence of phenomena still to be determined
3 – Experimental results a) Ion Cyclotron Emission from the plasma edge with NBI Comparison with results from other machines: focus on JET and TFTR: these are the most typical and the most studied. With D-T JET • Experiments both with D and D-T NI injection. • ICE measured with ICRF antenna connected to spectrum analyzer • Frequencies match ΩDl=Ωαl (l: harmonic) at the edge in the midplane (3.9<R<4.1m). • For l<8, even l-line more intense • Fine structure appears: split into doublet and triplet (when l increases) • For f>100MHz, continuum • Same structure of spectrum both for D NI and T-D NI (No Triton line observed) • Measured level of ICE power proportional to neutron flux • ICE disappear with large amplitude ELM. With D Typical experimental parameters
3 – Experimental results We observe three different types of signals in different conditions: a) Ion Cyclotron emission at the plasma edge during NBI heating b) Ion Cyclotron emission at the plasma edge during ICRF heating c) Ion Cyclotron emission at the plasma center during NBI heating
3 – Experimental results b) Ion Cyclotron Emission from the plasma edge with ICRF (MW) (s)
3 – Experimental results b) Ion Cyclotron Emission from the plasma edge with ICRF 3rd harmonic H Harmonic Generator (filtered) 2nd harmonic H Main frequency Generator (filtered) + 1st harmonic H Radiated power (MW) ICRH (s)
3 – Experimental results b) Ion Cyclotron Emission from the plasma edge with ICRF 3rd harmonic H Harmonic Generator (filtered) Result of the modulation between 1st harmonic H and main generator frequency 2nd harmonic H Main frequency Generator (filtered) 1st harmonic H Radiated power (MW) ICRH (s)
3 – Experimental results b) Ion Cyclotron Emission from the plasma edge with ICRF • We have a good correlation between the FFT of the signal and the theoretical ion cyclotron frequency of Hydrogen in the midplane, 2cm outside the separatrix (r≈2.15m). • 1st and 3rd H-harmonics more intense • Presence of the modulation between main generator frequency and 1st H-harmonic • Fine structure and evolution of frequencies observed. 3rd harmonic H Harmonic Generator (filtered) 2nd harmonic H Main frequency Generator (filtered) + 1st harmonic H Radiated power (MW) ICRH (s)
3 – Experimental results b) Ion Cyclotron Emission from the plasma edge with ICRF Conditions of excitation This plot the characteristics Power/ edge Density (average value) for all shots with ICRH in campaign 2009. The conditions for excitation of frequencies seem to be a high level of ICRF power (>3MW) associated with low density plasma. The signal is also sensitive to the presence of NBI heating. ICRF Frequencies observed for minority heating D(H). Only L-modes (no pure ICRH H-mode at low density possible due to sputtering problems) NBI NBI ICE signal
3 – Experimental results b) Ion Cyclotron Emission from the plasma edge with ICRF Characteristics of the ICE signal Frequency dependant on the magnetic field and on the generator frequency. It is not possible to determine which one has an influence on the ICE frequency since the generator frequency is tuned to the magnetic field to have heating at the center Shot 23294 Generator freq 30MHz 23.5MHz Bt=-1.99T Time(s) Shot 23515 Generator freq 36.5MHz 28MHz Bt=-2.3T Time(s) ~28MHz
3 – Experimental results b) Ion Cyclotron Emission from the plasma edge with ICRF Characteristics of the ICE signal Splitting of frequencies. • Two types of splitting are observed: • A large one: Δf≈900kHz • An intermediate one: Δf≈100kHz • This kind of splitting is not observed for each shot with ICE. Large splitting Intermediate splitting • An interesting observation that needs to be confirmed and explained concerns the relation between splitting and time evolution of frequencies: • When the ICE frequency does not change in time, there is no splitting: only one frequency is present in the spectrum • When the ICE frequency changes with time: splitting is observed and we have several frequencies at a time. ~28MHz
3 – Experimental results b) Ion Cyclotron Emission from the plasma edge with ICRF Comparison with Minority Ion Cyclotron Emission on JET [Cottrell00] This is, to our knowledge, the only documented case of ICE detected with ICRF heating on a tokamak. The spectrum reveals a frequency corresponding to ion cyclotron frequency of hydrogen (minority species). The ICE signal is correlated with a change of slope in the diamagnetic energy, that means a loss of fast ions in the plasma core. Without ICE With ICE Spectrum with and without ICE [Cottrell00] ICE correlated with loss of fast ions [Cottrell00] ~28MHz
3 – Experimental results We observe three different types of signals in different conditions: a) Ion Cyclotron emission at the plasma edge during NBI heating b) Ion Cyclotron emission at the plasma edge during ICRF heating c) Ion Cyclotron emission at the plasma center during NBI heating
3 – Experimental results b) Ion Cyclotron Emission from the plasma center with NBI
3 – Experimental results b) Ion Cyclotron Emission from the plasma center with NBI When neutral beam is injected into the plasma, a frequency corresponding to the second harmonic of Deuterium at the plasma center appears transiently for a duration of about 80ms. The level of signal is very low (maximum 150mV) in comparison with the edge ICE. 2nd harmonic D 1st harmonic D Radiated power NI3
3 – Experimental results b) Ion Cyclotron Emission from the plasma center with NBI It the ion beam is modulated in power, the ICE signal reappears at each pulse. The frequency follows very accurately the ion cyclotron frequency at the center of the plasma.
3 – Experimental results b) Ion Cyclotron Emission from the plasma center with NBI Conditions of observation This signal appeared for all shots of the campaign 2009 with NBI except for a few ones. The ICE signal is observed only when tangential beams are injected: the few measurements with radial beams and current drive beams did not reveal any ICE signal. (see shot #24593) The excitation of the frequency is not linked to a power threshold of the NBI: we can get a signal with only one beam at 2MW.
3 – Experimental results b) Ion Cyclotron Emission from the plasma center with NBI Characteristics of the signal Splitting Shot 24631 When NBI is modulated in power, we can observe during some pulses, a ‘splitting’ of the ICE frequency: the main ICE frequency remains but a second frequency appears shifted of about 2MHz. We haven’t found any correlation with other processes at stake in the plasma. However, the effect of ECE heating is still under investigation because this system is operated when this splitting occurs.
3 – Experimental results b) Ion Cyclotron Emission from the plasma center with NBI Characteristics of the signal Intermittencies There are some cases where NBI delivers steady power and yet, the ICE signal is intermittent and with a total duration of several hundred of milliseconds (instead of 80ms).
3 – Experimental results b) Ion Cyclotron Emission from the plasma center with NBI Characteristics of the signal Excitation of several harmonics When adding a second beam to the first one, the second Deuterium harmonic disappear and the thrid one appears. But we also have cases where 2nd and 3rd harmonics are simultaneously excited. Jump from2nd to 3rd harmonic +NI8 NI3
4 – ICE theories and interpretation Back to outline
V V 4 – ICE Theories Suprathermal ICE at the edge: overview of the mechanism 1 Source of free energy available at the edge: inversion of fast ion population Wedged ring distribution at the edge for fast ions 2 3 Eigenmodes localized at the edge Resonance condition for energy transfer Essential contribution of bulk ions in cold plasma approximation (even MHD). The wave propagation equation coupled to the plasma geometry makes it possible to compute the localized eigenmodes (CAE Compressional Alfven Eigenmodes). We obtain: position, frequency and k of the modes The distribution of fast ions is injected perturbatively in the anti-hermitian part to calculate the growing rate of the eigenmode. This growing rate is associated with the resonant condition:
Large extension Trapped Passing V Fast ions responsible for ICE Pitch angle boundary for edge access Trapped/passing boundary V 4 – ICE Theories 1 Fast ions distribution function 2 constraints on energy and pitch angle TRANSP results for JET: extension of orbit related to energy and pitch angle [Cottrell95]
4 – ICE Theories Fast ions distribution function The question is to know which species the fast ions are made of. Experiments on JET show that the ICE intensity correlates with the neutron rate. Primary fusion reactions D + D -> 3He (0.82MeV) + n (2.45 MeV)D + D -> T (1.0 MeV) + p (3.0 MeV) Secondary fusion reactions 3He + D -> p (14.6 MeV) + 4He (3.7MeV)T + D -> 4He (3.6MeV) + n (14.0 MeV) Correlation between ICE power and neutron rate on JET [Cottrell95] Power fcP 2fcP 3fcP -> protons are the drivers and the Doppler shift due to their large velocity drift is high enough to also excite half harmonics -> protons are the drivers and half harmonics are excited by non linear mode coupling with energy redistribution between the different harmonics (that would also explain the similarity of spectra with D-T and D-D) -> alpha particles (secondary products in D-D plasmas) are the drivers: their concentration is very low and the ICE has to be very sensitive to this concentration Energy transfer Doppler fcD 2fcD 3fcD 4fcD 5fcD 6fcD f fcα 2fcα 3fcα 4fcα 5fcα 6fcα Theoretical energy spectrum
3 – Experimental results On ASDEX Upgrade 4nd harmonic He3 5th harmonic D 4rd D/3rd He3 3rd harmonic D 2nd harmonic He3 2nd harmonic D (MW) +NI4 +NI8 +NI5 +NI1 NI3 Radiated power (s)
5 – Interpretation of results On ASDEX Upgrade Vertical central line
Whispering Gallery modes 4 – ICE Theories 2 Determination of eigenmodes It is the simplest case considered but often used. It corresponds to an infinite aspect ratio, i.e., B is only dependent on the radius. Poloidal symmetry => poloidal wavenumber is discrete: 1D case (cylinder): [Coppi86][Gorelenkov95][Hellsten04] We take the Fast Wave equation in its straight geometry MHD form: ‘inverse Fourier transform’ [Gorelenkov95]
5 – Interpretation of results On ASDEX Upgrade We took the cylindrical model of eigenmodes presented in the theoretical section and we used a density profile model fitted to the data from the Lithium beam. We notice that we have a peaked profile (the same as in JET). Separatrix Comparison model – data for density profile Solving the 1D field equation gives us the following result: we can have confined modes for high m (poloidal number). The location of the mode (2.04m) is lower than the one obtained by matching the frequency (2.15). But the model is simple and the basic frequency matching does not take into account any Doppler shift. Solution of the potential equation
4 – ICE Theories Determination of eigenmodes Toroidal case, high aspect ratio, circular profile: [Coppi85], [Gorelenkov95] The main tool used here is the eikonal representation: We have a ε<<1 and 1/m<<1; thus, we can develop the eikonal in powers of 1/m and ε to give corrections due to toroidicity in the eikonal equation which is of the form: We took here the cold plasma equation in complete cylindrical coordinates. At the lowest order in 1/m and ε, the equation obtained can be approximated by a 2D harmonic oscillator, which means that the mode is still contained with a slight correction to the cylindrical case. But this is valid only under the condition that: Ray trajectory of contained mode with toroidal deformation [Coppi85] If we have coupling between radial and poloidal mode, a secular contribution is added and we lose the confinement of the mode. This is better seen with the geometrical optics approximation (for short wavelength); The following equations are solved numerically: Drifting ray trajectory [Coppi85]
4 – ICE Theories Particles/Waves interactions The plasma is described by the dielectric tensor: => Energy transfer and mode growth rate γ 2 groups of theories Strong instability Weak instability Growth Growth time time
4 – ICE Theories Particles/Waves interactions Strong instability The wave electric field is approximately polarized in the plane perpendicular to the magnetic field direction. The dispersion relation is then: The dielectric tensor contains contributions from electrons (e), bulk ions (i) and energetic ions (α):
4 – ICE Theories Particles/Waves interactions (3/10) This is for the case with quasi-perpendicular propagation. If we add a parallel component to the wave vector, we get the effects of Landau and transit time damping. Maxwellian electron contribution: It is calculated in the hot plasma case. ζl represents the relative shift to the ion cyclotron frequency. If >>1, we have the cold plasma approximation. If ~1, hot plasma effects have to be taken into account with damping. Bulk ion contribution: Fast ions contribution: This is the source of the instability. The Π operator applied to the distribution function determines the stability of the interaction (sign of imaginary part). The resonance condition: two terms play a role: v// and ωD. They determine the Doppler shift
ω/ωcα Bernstein wave (hot plasma) Excitation k(cm-1) 4 – ICE Theories Particles/Waves interactions Fast ions affect both the structure of the wave (real part of the dispersion relation) and the transfers of energy (imaginary part of the dispersion relation). The concentration of fast ions is small, so the growth rate of the excited modes. => use of perturbative analysis Wave structure with fast ions Case without fast ions Fast wave (cold plasma) Case with fast ions New component due to fast ions Wave propagation [Fulop97]
3 – Experimental results On ASDEX Upgrade Alfven mode m²/r²·VA ~28MHz
4 – ICE Theories Particles/Waves interactions (5/10) Actually, there are two ways to handle the local theory: each leads to different types of excited waves and thus, to different growth rates for each harmonics. k//=0 approach [Fulop] k//<<1 approach [Dendy, Coppi] Here, the Doppler shift is only due to the toroidal drift of the fast ions. The positive and negative poloidal modes account for the doublet splitting observed on JET ICE. Here, the Doppler shift is due to the parallel velocity of the fast ions. Details of the distribution function account for the excitation of all harmonics and the splitting in doublets. The alphas are responsible of the excitation and they can excite all harmonics. The growth rate is sufficiently high to be coherent with the local approximation. According to Fulop, it is not the case the k//≠0 approach. The shape of the spectrum is very dependent on the propagation angle.
5 – Next steps Back to outline
5 – Next steps We collected some pieces of evidence that the signal measured corresponds to ICE • - The signal observed matches well with the ICE frequency. • The signal is correlated with the global neutron rate • The signal is correlated with MHD events We have now three targets we aim at: A- to confirm that the signal is ICE excited by fast ions B – to use ICE as a tool to investigate fast ions and MHz eigenmodes C – to manipulate the eigenmodes and their interactions with the fast ions
5 – Next steps • To conclude • This preliminary study shows that the signal observed is very probably the Ion Cyclotron Emission resulting from the interaction between fast ions and compressional alfven eigenmodes. • Further work targets at describing the particles population involved in this interaction and improve the measurement for a better support of the existing theories. • Understanding ICE is important because: • It can be used as a diagnostics for the fast ions at the edge • It can perturb the arc detection systems based on frequency signature • It can enhance the interaction of the ICRF fast waves at the edge with other waves leading to spurious power absorption