Download
1 / 31
330 likes | 702 Views
Understanding the BEP. TASBO Breakout Session Murfreesboro, Tennessee November 16, 2011. History of the BEP. 1977—enactment of Tennessee Foundation Program—funding formula that increased state’s contribution and used local property value to determine a county’s ability to pay.

E N D
Understanding the BEP TASBO Breakout Session Murfreesboro, Tennessee November 16, 2011
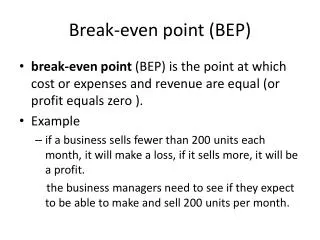
History of the BEP • 1977—enactment of Tennessee Foundation Program—funding formula that increased state’s contribution and used local property value to determine a county’s ability to pay. • Late 1980’s—Tennessee Foundation Program (TFP) • State Board of Education began working with various groups to reform education funding • TFP appropriations were around $900 million • Weaknesses in the TFP: • Inadequate • No adjustment for inflation • Targeted “formula”—inflexible funding • Insignificant amount of funding for consideration of local ability to pay
History of the BEP • 1988—77 Small school systems sued the state, claiming TN’s funding formula was inequitable. TN Supreme Court agreed and ordered the state to develop a plan to correct the school funding program. • 1992—passage of the Education Improvement Act, which implemented a new funding formula, called the Basic Education Program (BEP). • Funding mechanism with components necessary for funding a “basic” education • No “targeted” funding. • Funding is flexible: BEP is a funding formula not a spending plan. • Formula considers local ability to pay at a more significant level.
History of the BEP • 2007—BEP 2.0 passed • Largest increase in state funding for education--$280 million • Not fully implemented. Cost to fully implement-$205 million
FY12 BEP--By the Numbers • 950,244 • $3,754,398,000 • 62,370 • $76.75 • $38,700 • 560,000
FY12 BEP--By the Numbers • 950,244—Total funded ADMs • $3,754,398,000—State Cost of BEP • 62,370—Professional positions generated • $76.75—Unit cost for Textbooks • $38,700—Teacher Salary Unit Cost • 560,000—At Risk Students
How Does the BEP Work? • Two Separate Parts: • Funding—Department of Education determines need. • Local Ability to Pay or Fiscal Capacity—Tennessee Advisory Commission on Intergovernmental Relations (TACIR) and UT Center for Business and Economic Research (CBER) provide fiscal capacity indices.
Determining Need--ADMs • ADMs (average daily membership) drive the Formula—funded on prior year’s ADMs • Regular ADMs, Special Ed Identified and Served, Vocational WFTEADM • Funding months and weighting • month 2 - 12.5% month 6 - 35.0% • month 3 - 17.5% month 7 - 35.0% • ADMs generate: • Positions—teachers, supervisors, assistants • Funding dollars—ADMs are multiplied times a Unit Cost • Supplies, equipment, textbooks, travel, capital outlay, etc.
Unit Costs—source and calculation • Equipment, supplies, travel, substitute teachers—actual costs from E-reporting. • 3 year average • average is inflated up two fiscal years • Textbooks—projected current year cost obtained from Office of Textbook Services • 3 year average • average is inflated up one year • Alternative Schools, Duty Free Lunch, Maintenance and Operations • Prior year value inflated up one year • Capital Outlay • Square footage cost obtained from RS Means publication • Formula –each ADM generates square footage, multiply times cost, include architect fees and equipment. Then amortize to arrive at yearly cost.
Fiscal Capacity TACIR Model Per Pupil Own-Source Revenue Amount of local money that the school systems in the county report that they spend on education, divided by enrollment (average daily membership (ADM) Per Pupil Equalized Property Assessment Total property assessment for the county area, equalized by the appropriate county appraisal-to-sales ratio, and then divided by ADM. This is a measure of the local ability to raise revenue. Per Pupil Taxable Sales Local sales tax base divided by ADM-measure of the local ability to raise revenue. Per Capita Income Per capita income is included in the fiscal capacity model as a proxy measurement for ability to pay for education; and for all other local revenue not accounted for by property or sales taxes. Tax Burden Ratio of total equalized residential and farm assessment in each county divided by the total equalized property assessment. This variable is intended as a proxy for a county’s potential ability to export taxes. A high residential/farm ratio indicates a low ability to pass taxes on to non-residents. Service Burden Included as a reflection of spending needs. It equals average daily membership divided by county population. The greater the number of pupils per 100 residents, the greater the fiscal burden for each taxpayer.
CBER Model (New Model) • The new formula determines a county’s capacity to raise local revenues for education from its property and sales tax base. • Each county’s fiscal capacity is the sum of: • The county’s equalized assessed property plus IDBs multiplied by a statewide average property tax rate for education (1.1583%) • The county’s sales tax base multiplied by a statewide sales tax rate for education (1.5570%) • Each county’s fiscal capacity index is the ratio of its fiscal capacity to total statewide fiscal capacity.
CBER Calculation Example Davidson County Equalized Assessed Property plus IDBs (3-year average): $ 19,130,924,199 Sales Tax Base (3-year average): $ 10,702,878,267 Fiscal Capacity =($19,130,924,199 x 1.1583%)+ ($10,702,878,267 x 1.5570%) = $221,593,495+ $166,643,815 = $388,237,310 = $ 388,237,310 /$2,754,000,000 (state total) Fiscal Capacity Index = 14.10%
Fiscal Capacity Used in FY12 BEP 50% of TACIR Model & 50% of CBER Model Davidson County Index (TACIR Capacity Index x .50) + (CBER Capacity Index x .50) 14.50% x.50 + 14.10% x.50 =14.30%
Davidson County BEP Funding Example Classroom Funding Instructional Funding Non-Classroom Funding Total State BEP Funding $223,217,000
Coffee County BEP Funding Example Classroom Funding Instructional Funding Non-Classroom Funding Non-Classroom Funding Total State BEP Funding $17,890,000
For further information…. • Tennessee Basic Education Program: An Analysis • http://www.comptroller1.state.tn.us/orea/ • See the Legislative Brief • State Board of Education • http://www.tn.gov/sbe/bep.html • BEP Blue Book—up to date data on BEP components • Recommendations of BEP Review Committee
Maintenance of Effort • Supplanting test used to insure maintenance of local effort. • Governed by: • TCA §49-2-203; and TCA §49-3-314 • Budgeted local revenue must be equal or greater than the previous year’s amount, unless ADMs have decreased.
3% Fund Balance Test • If budgeted expenditures exceed revenues, LEA must have 3% of operating expenditures in fund balance, before budget will be approved.
TCA §49-3-352(c)Uses of Fund Balance • Provisions applicable after operating budget is adopted. • …shall be available to offset shortfalls of budgeted revenues… • …shall be available to meet unforeseen increases in operating expenses.
TCA §49-3-352(c)Uses of Fund Balance • The accumulated fund balance in excess of three percent (3%) of the budgeted annual operating expenses for the current fiscal year may be budgeted and expended for any education purposes but must be recommended by the board of education prior to appropriation by the local legislative body.
TCA §49-3-352(c)Uses of Fund Balance • In other words, there is no requirement to have 3% of operating expenses in fund balance – but LEAs cannot use fund balance unless the fund balance exceeds 3% of operating expenses. If the fund balance is in excess of 3% of operating expenses, then the excess can be used for any education purposes, as long as the use is first approved by the board of education.