Download
1 / 35
350 likes | 682 Views
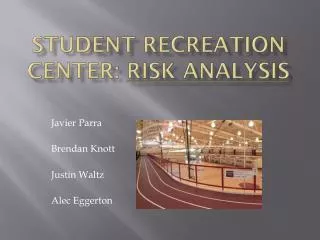
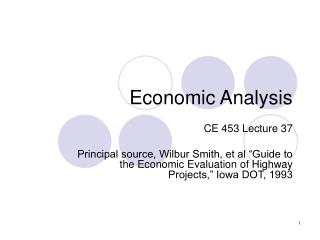
Recreation Economic Analysis. Session Contents. Recreation Economics NED Benefit evaluation methods for recreation Unit Day Value Travel Cost Method Contingent Value Method Be able to compare alternative methods for measuring recreation economic benefits. Types of Economic Values.

E N D
Session Contents • Recreation Economics • NED Benefit evaluation methods for recreation • Unit Day Value • Travel Cost Method • Contingent Value Method Be able to compare alternative methods for measuring recreation economic benefits.
Types of Economic Values Economic Efficiency (NED) • Net willingness to pay: What you would be willing to pay over and above actual expenditures (consumer surplus). Economic Impacts (RED) • Actual Expenditure • Convert to income – employment • Transfer from one region to another
Travel Cost Method • The basic premise of the travel cost method is that per capita use of a recreation site will decrease as out-of-pocket and time costs of traveling to the site increase, other variables being constant. TCM, consists of deriving a demand curve by using the variable costs of travel and the value of time as proxies for price. This method may be applied to a site-specific study or a regional model.
Outdoor Recreation Considerations • Lack of Market Prices • Locational Costs of Supply • Individuals Do Not Face Same Costs • Qualitative Differences Between Sites • Non-marginal Changes in Supply
Using the Variation in Travel Costs and Trips Taken to Trace Out a Demand Curve – Mt. Rainer
Example: TC “Price” Calculations Assumptions: 3 Persons (adults) per vehicle Per capita curve based on one-way distance Variable travel costs = $0.126/mile Average wage rate = $ 12.00/hour Average travel speed = 40 mph Variable TC: Cost/mile/person = $.126/3 = $ 0.042 Cost/person/10 mile increment =$ 0.42 Time Cost: Time cost/hour = $12.00/3 = $ 4.00 Travel time/10 mile increment = .25 hour Time cost/10 mile increment = $ 1.00 Total Cost: Travel & time cost/increment = $ 1.42 Round trip cost (x2) = $ 2.84
Example Regional Travel Cost Model Visits per capita = a + b1 (travel cost) + b2 (site quality) + b3 (substitutes)
PROS: Based on observation of use Intuitively sound Provides use estimate CONS: Expensive Data extensive Need a variance of distance Multiple recreation destinations Travel Cost Method
Contingent Valuation Method The contingent valuation method estimates NED benefits by directly asking individual households their willingness to pay for changes in recreation opportunities at a given site. Individual values may be aggregated by summing willingness to pay for all users in the study area. This method maybe applied to a site-specific study or a regional model Sometimes Referred To As: • Bidding Game • Direct Question Method • Survey Method
Assumptions of CVM • Individuals can accurately assign a dollar value • This “true value” can be correctly elicited
Potential Sources of Bias • General • Hypothetical • Strategic • Instrument • Starting Point • Vehicle • Information • Interviewer
Components of CVM Questionnaire • Background/Behavioral • Willingness to Pay • Socio-economic (can be controversial)
Type of Survey • Personal Interview • Mail • Telephone • Combination
PROS: Can account for quality Flexible Can simulate a range of alternatives CONS Requires OMB survey approval Expensive Technically challenging Questionable results Contingent Value Method
Unit Day Value Method • The unit day value method relies on expert or informed opinion and judgment to estimate the average willingness to pay of recreation users. By applying a carefully thought-out and adjusted unit day value to estimated use, an approximation is obtained that may be used as an estimate of project recreation benefits. • The product of the selected value times the difference in estimated annual use over the project life relative to the without- project condition provides the estimate of recreation benefits.
Unit Day Value Criteria(How do we assign values?) • Recreation Experience = quantity and quality of recreation activities • Availability of Opportunities = availability of substitutes (higher value if there are fewer alternatives) • Carrying Capacity = Capability of recreation area facilities to support the current quantity and density of use • Accessibility = Access quality • Environmental Quality = e.g. aesthetics
Guidelines for Assigning Point: General Recreation Criteria Judgment Factors: Several general Several general Numerous high activities: one activities: more quality activities: Recreation Two general Several general high quality than one high some general experience activities activities activity quality activity activities Total Points: 30 Point Value: 0 - 4 5 - 10 11 - 16 17 - 23 24 - 30 Several within 1 Several within 1 One of two within hr. travel time: a hr. travel time: 1 hr. travel time: Availability of few within 30 none within 30 none within 45 None within 1 hr. None within 2 hr. opportunity min. min. min. travel time travel time Total Points: 18 Point Value: 0 - 3 4 - 6 7 - 10 11 - 14 15 - 18 Carrying Capacity Total Points: 14 Point Value: 0 - 2 3 - 5 6 - 8 9 -11 12 - 14 Accessibility Total Points: 18 Point Value: 0 - 3 4 - 6 7 - 10 11 - 14 15 - 18 Environmental Total Points: 20 Point Value: 0 - 2 3 - 6 7 - 10 11 - 15 16 - 20
PROS: Inexpensive Relatively easy Understandable Can account for quality CONS: Not site specific Relies on expert or informed opinion Limited use by regulation Unit Day Value Method
ER 1105-2-100, Figure E-10 Selection Criteria Method Selection Criteria
Criteria for evaluation • Based on an empirical estimate of demand applied to the particular project. • Reflects the socioeconomic characteristics of market area populations, qualitative characteristics of the recreation resources under study, and characteristics of alternative existing recreation opportunities. • Accounts for the value of losses or gains to existing sites in the study area affected by the project (without-project condition). • Willingness to pay projections over time are based on protected changes in underlying determinants of demand.
Recreation Benefit Evaluation Procedures Define study area Estimate recreation resource Forecast recreation use Determine without-project condition Forecast recreation use diminished by project Forecast recreation use with project Estimated value of recreation use with project Estimate value of recreation diminished by project Compute benefit
Summary • Objective = The student will be able to list at least one advantage and disadvantage for each of the three accepted methods for computing recreation benefits.
General Measurement Standard Willingness of users to pay for each increment of output from a plan. • Measurement Techniques • Actual or simulated prices • Changes in net income • Cost of most likely alternative • Administratively established values
Demand • Maximum quantities an individual is willing to buy for various prices of a good or service of a given quality. • Maximum prices an individual is willing to pay for various quantities of goods or services of a given quality.
Supply and Use Supply: Maximum quantities available at various prices of a good or service of given quality. Use: Quantity of a good or service actually consumed by all individuals at existing price(s) Supply-Demand Equilibrium.
Example Simple Travel Cost Model:Visits Per Capita = a + b (Travel Cost)
Similar Project Approach Using Concentric Distance Zones As Origins
Non-lake Recreation • Appendix E, ER 1105-2-100 Contains the list of approved recreation facilities (generally not vendible) • More than 10 % of costs need prior ASA approval (non-lake) • On project lands not purchased for recreation (exception is parking lots or facilities for health and safety) • For ecosystem restoration the facilities must be compatible to the project outputs (enhance the visitation experience by taking advantage of natural values) • Local sponsor to cost share 50-50, and O&M