Download
1 / 62
650 likes | 997 Views
MIS. Headcount Reconciliation Headcount database Reconciliation process Staffing Strategy Using the Staffing Strategy template and understanding the calculation Occupancy Regression Analysis Understanding the calculations used to determine Occupancy and Service Level targets

E N D
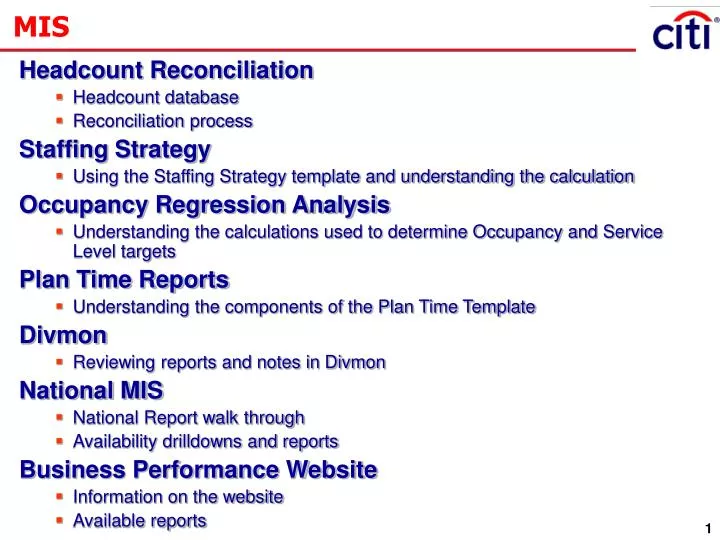
MIS Headcount Reconciliation • Headcount database • Reconciliation process Staffing Strategy • Using the Staffing Strategy template and understanding the calculation Occupancy Regression Analysis • Understanding the calculations used to determine Occupancy and Service Level targets Plan Time Reports • Understanding the components of the Plan Time Template Divmon • Reviewing reports and notes in Divmon National MIS • National Report walk through • Availability drilldowns and reports Business Performance Website • Information on the website • Available reports
MIS-Headcount Reconciliation Headcount Reconciliation • Why do we reconcile headcount? • To ensure the cap plans are reflecting the most accurate information on headcounts, due to attrition, transfers, etc. • What is the headcount database? • The headcount database is an Access database, populated by Global Data Warehouse(GDW), and is used to create reports. • The database contains the following information by business and by site: • Headcount • Attrition • Transfers in and out • New Hires • Officer Breakdowns • FT/PT Status • TCS Staff Assignments • Moves from Staff to Officer
MIS-Headcount Reconciliation Headcount Reconciliation • Locate the database in the following location: Capplan2$/Capacity Planning/Headcount/Headcount.mdb • Choose the business and site in the drop down boxes. • Select the month to reconcile by using the begin and end boxes. • Click on the “Consolidated Report” button.
MIS-Headcount Reconciliation Headcount Reconciliation • The report contains the following information in this order: • Headcount, Attrition, Transfers Out, New Hires, Transfers In, PT/FT and Officer Changes, Officer Breakdown, Officer Detail, Missing TCS, and Staff Group Detail with Grade.
MIS-Headcount Reconciliation Headcount Reconciliation • To export the report to Excel, Select the drop down button next to the Microsoft Word Icon. • Select the “Analyze it with Microsoft Excel” • The report will transfer to an Excel type spreadsheet. • Copy and paste into the Headcount files.
MIS-Headcount Reconciliation Headcount Reconciliation • Helpful Hints: • Column headers are not present. • Some columns may move over a column if data is not available for another field. • If a group is missing data for a specific field, like attrition or new hires, it will not appear on the consolidated report. There will be a blank space.
MIS-Headcount Reconciliation Headcount Reconciliation • What are the next steps? • Get with Connie?
MIS-Staffing Strategy Staffing Strategy Calculations • What is a Staffing Strategy? • A calculated percentage of the workload FTE requirement added to the workload requirement to derive to “Total FTE Required” • Why is a Staffing Strategy used? • To ensure adequate staffing levels to cover the variables or “peaks” in call volumes, handle times, etc. • A Staffing Strategy allows us to be an acceptable amount over staffed to cover these variables. • How is the Staffing Strategy % calculated? • The target is based on the variability in the call volume, excluding any outliers or exception days • The variability is calculated by day, then averaged for the monthly target
MIS-Staffing Strategy Staffing Strategy Model • Excl Outliers – This is the recommended staffing strategy percent. • In this scenario, the strategy would be 4.97% or 5% • If a major change in the business has occurred, strategy should be reviewed • Data Points Included - calculates the number of days included in the calculation as compared to the total number of days available
MIS-Staffing Strategy Calls Offered • Historical data is pulled into model • At least 1 year of data should be used • Sorted by day of week
MIS-Staffing Strategy Calls Offered • Standard Deviation is determined by Day of Week (DOW). • Median is determined by DOW • The max and min ranges are determined • Outliers are excluded based on the ranges
MIS-Staffing Strategy Calls Offered Metrics • Outliers are excluded based on the ranges determined • The Standard Deviation and Median ranges are calculated on the remaining data points • Standard Deviation divided by median determines percent for staffing strategy by DOW
MIS-Occupancy Regression Analysis Occupancy Regression • What is a Regression Analysis? • A statistical technique used to find relationships between variables for the purpose of predicting future values. The model uses numerical values, such as call volumes, service level, occupancy and ASA. • What is the Occupancy Regression model used for? • To determine what the appropriate target for Occupancy and ASA should be based on the desirable service level goal. • The model also ensures that we are employing the same methodology and data set time period for all businesses. • When are the Occupancy targets reviewed? • The regression is reviewed in June for the upcoming year planning. • It is also reviewed, as needed, due to changes in the business.
MIS-Occupancy Regression Analysis Occupancy Regression • The Occupancy Regression Model can be accessed via the following SharePoint site link: https://cards.collaborationtools.consumer.citigroup.net/sites/NationalCapacityPlanning/default.aspx
MIS-Occupancy Regression Analysis Occupancy Regression • Under the “other” tab, open the folder called Regression Analysis • Open the file named “Revised Service Level and Occ Model”.
MIS-Occupancy Regression Analysis Occupancy Regression • Once the model is open, go to “Datastdev1” tab and enter the row number of the group that the Regression is being calculated on. • The row number for the appropriate answering group can be found on the ‘Answering Group List” tab.
MIS-Occupancy Regression Analysis Occupancy Regression • Select the appropriate date for the group that is being targeted for the regression. Adjust the formulas at the bottom of the”Datastdev1” tab to target the correct data set.
MIS-Occupancy Regression Analysis Occupancy Regression • Once all the volume is set and reflected on the “All Days@stdev1” tab, make sure the “Chart” is calculating the correct results. The formulas on the “Chart” tab reference data in rows AD through AI on the “All Days@stdev1” tab. • When analyzing a new group, that does not have historical data for all of the days, the trend formulas will need to be adjusted to only include the dates with data.
MIS-Occupancy Regression Analysis Occupancy Regression • Once the formulas are correct, the Occupancy goal in column G can be calculated by adjusting the ASA in Column B to the desired ASA goal. • The graph above the data displays the results that are calculated. • If 2 standard deviations are needed, change the trend formulas to reference the “All Days@stdev2” page.
MIS-Variance Goal Goals • What is a goal? • A goal is established to achieve the plan and the forecast. It is our target. • How are goals set? • Goals need to be obtainable, but also need to be a stretch. If goals are easy to obtain, the business will appear to be running better than it actually is. We are in a business where optimal goals, not obtainable goals, should be the standard.
MIS-Variance Goal Goals • What are the keys to establishing goals? • Goals must be established beyond the forecasted targets • Goals must be reasonable and attainable • Goals must be measurable • Communicating the goals to the management team so that they understand their role • Participation from the management team in helping to achieve the stated goals • Management consistently providing feedback to their teams on a daily basis
MIS-Variance Goal Goals Discussion Needed around goals!
MIS-Plan Time Reports Plan Time Reports • Why should Plan Time Utilization be monitored? • To ensure availability goals are met • To ensure that agents utilize their plan time resulting in minimum carry over • How is Plan Time Utilization monitored? • Reports are updated monthly, detailing the most recent data available in EWFM and Peoplesoft • Reports are sent out to business leaders, SFE support team, and Cap Planners
MIS-Plan Time Reports Plan Time Template - Summary 1 Business Site Total productive agents in EWFM at the end of the month Total Planned, Holiday, Angel and Carryover that each agent is entitled for the year, as reflected in Peoplesoft Amount of hours taken and scheduled as shown in EWFM % of Remaining Waitlist Detail Total % plan to available hours to estimate what plan time is running for current year. Break down of plan time by shift status Headcount by shift 2 3 4 5 6 7 8 9 10
MIS-Plan Time Reports Plan Time Template – Division Total 1 2 Business Month Headcount by month for New Hires Headcount by month by tenure. Total Plan and Holiday hours entitled. % of Entitled – Total entitled to available hours Additional entitled hours % Additional Entitled – Total additional entitled to available hours Total Plan due all buckets Available Hours for the month Time taken by bucket % Plan Taken – Plan taken to available hours Hours remaining – Plan hours remaining, estimated by prior year usage Estimated Plan % usage, by month Waitlist Summary 3 4 5 6 7 8 9 10 11 12 13 14 15
MIS-Plan Time Reports Plan Time Template – Site Total • Additional sheets are provided for site level detail. • The highlighted row –Revised Plan % - should be used in the cap plan
MIS-Divmon Log On Screen • Divmon is a tool used to monitor call metrics, by business. • The Sign On screen allows you to sign on, utilizing your Single Sign On ID, or manage passwords.
MIS-Divmon Real Time • The real-time Performance Report supplies current interval data. The TCC uses this report for daily management. • To view Real Time reporting, select the Real Time tab. • The Real Time monitor will display. • Select the department to view.
MIS-Divmon Real Time Definitions
MIS-Divmon Reports • On the Reports Tab, there are several report options to choose from. • Select the report you wish to look at in the drop down box. • Select additional criteria to include department name, # of days you wish to see, and date or date range.
MIS-Divmon Notes • The notes tab is utilized to input notes of down time, business impacts, or system outages for each business. • The TCC logs occurrences as trouble tickets are opened. • These notes should be viewed if you see a drop or spike in volume, or activity that looks out of the norm.
MIS-Divmon Notes • To view the note, select “Search Note” in the upper left hand corner. • Input your search criteria, and select “Search”
MIS-Divmon Notes • The notes log will appear. • Select “View/Edit” to see additional detail on the issue.
MIS-Divmon Configurations • The configurations report will give you detail by site of all the skills, Vdn’s and forecast groups that are configured into the IPR • On the reports tab, select configuration from the drop down under Report Name. • Select all of the criteria and “Run Report” • This can be used to validate Divmon to eWFM.
MIS-Divmon Interval Performance Report • The Interval Performance Report displays call metrics by half hour • The interval level detail updates every 30 minutes for.
MIS-Divmon Interval Performance Report Definitions
Page 1 MIS-National MIS National Book Summary Daily • Lines of business are listed along the top with the daily stats listed below.
MIS-National MIS National Book Summary MTD • Lines of business are listed along the top with the monthly stats listed below.
MIS-National MIS Definitions and Calculations
MIS-National MIS National Book VRU Report • Reports daily and monthly VRU data for the lines of business listed across the top.
MIS-National MIS National Book Availability Report • Availability data and calculations for daily and monthly views with category and site breakouts. • This is a snap shot of what is included in the drilldowns and/or online availability.
MIS-National MIS National Book Availability Report Definitions
MIS-National MIS National Book IPR Report • Business daily interval performance report for the business date. • This data represents the interval data that is contained in Division Monitor.
MIS-National MIS National Book Trends • Trending for key call center metrics for up to a 90 day history.
MIS-National MIS Availability Drilldowns • Access the drilldowns from the Business Performance Website, under the MIS link • First time users must download the database and save it to a local drive
MIS-National MIS Availability Drilldowns • Option to export and print reports • Select the date you wish to view • Several report options available • Select site and get report for preview
MIS-National MIS Availability Drilldowns • Division Availability Report • Daily, MTD and YTD reports available
MIS-National MIS Availability Drilldowns • Division Code Breakdown • Daily and MTD available
MIS-National MIS Availability Drilldowns • Planned By Site • Displays available hours and Plan Time hours by day.
MIS-National MIS Availability Drilldowns • Team drilldowns • Allows managers review teams stats and individual agents stats with a daily, MTD or YTD view