Download
1 / 25
250 likes | 414 Views
Source Apportionment of Personal Exposure of Fine Particulates in different micro-environments. Presenting And Main Author SHAMSH PERVEZ School of Studies in Chemistry Pt. Ravishankar Shukla University, India. Co-authors. NEELIMA M. GADKARI Department of chemistry

E N D
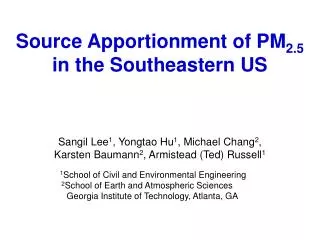
Source Apportionment of Personal Exposure of Fine Particulates in different micro-environments Presenting And Main Author SHAMSH PERVEZ School of Studies in Chemistry Pt. Ravishankar Shukla University, India Co-authors NEELIMA M. GADKARI Department of chemistry Govt. V.Y.T. Autonomous college Durg, India YASMEEN PERVEZ Department of Engg. Chemistry CSIT, Durg, India
Detail Investigation is Divided in Two Parts • Study of personal-indoor-ambient fine particulate (PM5) relationships among school community in mixed urban-industrial environment. • Source apportionment of personal exposure of fine particulates among school community in India INTRODUCTION • Children living in polluted areas with more particulate matter show a slowdown in lung function growth. • Study area is Bhilai-Durg, District Durg, Chhattisgarh, India • Infant mortality rate in study area is 73 per 1000 • About 135 schools having capacity of 50,000 students and 3000 teachers are running in the study area. • Accordingly Indian urban scenario, variety of sources of air pollution located in close proximity of these schools • Major sources are: An integrated steel plant, mixed heavy traffic exhaust and rode side runoff and other familiar urban local sources of air pollution. • Reason of selection of PM5: • The reported levels of PM2.5 is very low in various urban areas of india. Most of work reported is related to PM10. • The available personal particulate sampler and handy samplers cyclonic assembly attachments have cutoff point is 5 micron. • The ratio of PM5/PM10 was also measured for comparison with Indian National Ambient Air Quality Standards of fine particulate PM10 (NAAQS standards).
Fig. 1 Location map of schools in Bhilai-Durg, Chhattisgarh,India
S.No. Code Name of school** Age of school building/type of construction/ventilation quality Surrounding environmental conditions 01 School -X Govt. Higher Secondary School, Vaishali Nagar, Bhilai, Chhattisgarh, India 70 yrs/ concrete roofing/moderate 3 Km NW* from Integrated steel plant, Bhilai (close proximity) 02 School -Y Multipurpose Higher Secondary School, Durg India 100 yrs/tiled roofing (old version)/poor Close proximity to Heavy traffic zone (NH 6*) 03 School -Z Higher Secondary School, Sector 07, Bhilai Steel Plant Township, Bhilai, India 50 yrs/ concrete roofing/excellent Free from any major point source of PM* Relationship of Personal – Indoor - Ambient outdoor fine particulates: Methodology Selection of schools in study area *NW: Northwesterly; NH 6: National Highway No. 6; PM: Particulate Matter
Indoor, ambient-outdoor and personal PM5 sampling Subject Selection:- Time activity diary: 50 participants in each school. With prior consent category division of participant on the Basis of time activity diary: 1. Science discipline And 2. Non-science discipline Further category divided in: A. Teachers and B. Students 05 subjects in each sub-class (exception: 06 participants in each category in school-X) Sampler :A set of three personal respirable dust (Envirotech Model APM 801 Average flow rate: 1.1 Litre/min. Period : 24 hrs(08 hourly basis) ina 48 hr sampling period Frequency : 08-10 (twice a week) On the basis of school indoor activities,microenvironment divided in three regions: 1. Laboratory area, 2. Class rooms and 3. Office area Handy sampler sets (Envirotech Model APM 821) position: Indoor sampling: 04 feet and ambient outdoor: 10 ft Average flow rate: 2.0 Liters/min. Period: 24 hrs(08 hourly basis) , interval of one week Frequency: 30 throughout the sampling year Filter paper: Glass fiber microfilter sheets(35 mm dia.) (Whatman GF?A) Pretreatment: Dried for 24hrs at 80ºC in a oven before and after sampling Weighing: Single pan top loading 5 Digital Balance (Sartorius, Model R 200 D).(Triplicate measurement).
Regression analysis of indoor-ambient PM5 School-X School-Y School-Z
Results and Discussion Indoor- ambient PM relationships • Indoor PM5 is higher than its respective outdoor levels due to the various activities in the school indoors • School-X has shown higher PM5 compared to other schools. • Class rooms has shown higher PM5 compared to other school indoor microenvironments. • Highest PM5/PM10 ratio occur in School-X • Higher positive correlation between indoor and ambient-outdoor occurred in School-Z • Personal PM5 relationships • All subjects have shown higher personal PM5 concentration compared to their respective indoors and outdoors PM5 levels. • Subjects of science discipline have shown higher PM5 levels • Students have shown lower levels of PM5 compared to teachers. • Positive correlation with respective indoor and ambient-outdoor PM5 is high in School-X • Higher variability in PM5 levels occur in students class. • Females in all category have shown higher values of PM5
Source apportionment of personal exposure of fine particulates among school community in India • Overall major sources identified for personal exposure are: • Local ambient-outdoors, • School indoors, • Road traffic dusts and • Soils
Chemical Mass Balance Model Model Configuration Receptor species: A value and uncertainty is needed for each species Values below lower quantifiable limits may be included if uncertainty is set to LQL Source type selection: Common area sources (vehicle exhaust, geological material, secondary sulfate and nitrate) Natural sources (sea salt) Point sources in emissions inventory (coal combustion, residual oil combustion, smelting) Sources identified in PCA or preliminary analysis Source profiles in CMB solution: Upwind point sources Seasonal emitters Non-collinear profiles CMB Model Assumptions • Compositions of source emissions are constant over the period of personal and source sampling. • Chemical species do not react with each other (i.e., they add linearly) • All sources with a potential for significant contribution to the receptor have been identified and have had their emissions characterized. • The number of sources is less than or equal to the number of chemical species. • The source compositions are linearly independent of each other. • Measurement errors are random, uncorrelated, and normally distributed. • PM5 samples collected for source and receptor profile development were analysed as: • Fe, Ca, Mg, Li, Zn, Ni, Cd, Cr, Mn and Pb: AAS (Perkin-Elmer, A Analyst 100 • Na and K: flame photometrically(Chemito model 1000) • 3. Hg and As: Flow Injection Analysis-Mercury Hydride System (FIAS MHC AAS)(Perkin-Elmer)
sub date R2 Chi square TSTAT Indoor Road Soil Ambient VN1 12/3/03 0.69 8.70 7.29 -6.9 2.97 3.65 VN2 1/4/03 0.99 0.78 -0.03 -3.89 18.83 1.86 VN3 8/4/03 0.95 4.93 2.29 -3.86 15.66 2.41 VN4 27/4/03 0.99 0.35 2.15 -2.86 8.09 1.81 VN5 4/5/03 0.99 0.76 1.27 0.11 8.53 1.21 VN6 16/5/03 0.99 0.74 0.94 -0.28 7.69 0.78 CMB Output Parameters for School-X
sub date R2 Chi square TSTAT Indoor Road Soil Ambient MS1 5/5/03 0.48 1.04 1.21 -0.69 1.77 -0.55 MS2 11/5/03 0.72 0.57 1.16 -0.78 1.89 -0.53 MS3 21/5/03 0.62 0.66 1.15 -0.78 1.81 -0.50 MS4 2/6/03 0.72 0.65 1.32 -0.72 1.89 -0.55 MS5 15/6/03 0.53 0.72 1.06 -0.79 1.74 -0.49 CMB Output Parameters for School-Y
SITE VN2 DATE 1/4/2003 SITE VN6 DATE 16/5/03 SITE VN3 DATE 8/4/2003 SITE VN5 DATE 4/5/2003 SITE VN1 DATE 12/3/200 START HOUR 24DURATION 8 SIZE FINE START HOUR 24DURATION 8 SIZE FINE START HOUR 24 DURATION 8 SIZE FINE START HOUR 24DURATION 8 SIZE FINE START HOUR 24 DURATION 8 SIZE FINE ROAD 0% INDOOR 0% INDOOR 17% INDOOR 14% INDOOR 18% INDOOR 22% ROAD 0% ROAD 0% SOIL 38% ROAD 1% AMBIENT 48% ROAD 0% AMBIENT 52% SOIL 5% AMBIENT 55% AMBIENT 62% SOIL 31% SOIL 36% SOIL 30% SITE VN4 DATE 27/4/03 AMBIENT 73% Source Contributions Source Contributions START HOUR 24 DURATION 8 SIZE FINE Source Contributions Source Contributions Source Contributions INDOOR 25% ROAD 0% AMBIENT 52% SOIL 23% Source Contributions Source contribution estimates in School-X
SITE MS1 DATE 5/5/2003 SITE MS4 DATE 2/6/2003 SITE MS2 DATE 11/5/200 SITE MS3 DATE 21/5/03 SITE MS5 DATE 15/6/03 START HOUR 24 DURATION 8 SIZE FINE START HOUR 24 DURATION 8 SIZE FINE START HOUR 24 DURATION 8 SIZE FINE START HOUR 24 DURATION 8 SIZE FINE START HOUR 24 DURATION 8 SIZE FINE AMBIENT 0% AMBIENT 0% AMBIENT 0% AMBIENT 0% AMBIENT 0% ROAD 45% ROAD 47% ROAD 48% ROAD 49% INDOOR 51% INDOOR 52% INDOOR 53% ROAD 50% INDOOR 50% INDOOR 55% SOIL 0% SOIL 0% SOIL 0% SOIL 0% SOIL 0% Source Contributions Source Contributions Source Contributions Source Contributions Source Contributions Source contribution estimates in School-Y
SITE ST1 DATE 15/3/03 SITE ST2 DATE 1/4/2003 SITE ST4 DATE 22/4/03 SITE ST4 DATE 22/4/03 SITE ST3 DATE 10/4/200 START HOUR 24DURATION 0 SIZE FINE START HOUR 24 DURATION 0 SIZE FINE START HOUR 24DURATION 0 SIZE FINE START HOUR 24DURATION 0 SIZE FINE START HOUR 24DURATION 0 SIZE FINE SOIL 0% STEEL 0% ROAD 6% AMBIEND 0% AMBIEND 0% STEEL 0% AMBIEND 0% STEEL 0% AMBIEND 0% STEEL 0% STEEL 0% ROAD 15% ROAD 15% INDOOR 0% ROAD 5% SOIL 0% SOIL 0% SOIL 0% ROAD 31% SOIL 0% INDOOR 69% AMBIEND 94% INDOOR 85% INDOOR 85% Source Contributions INDOOR 95% Source Contributions Source Contributions Source Contributions Source Contributions Source contribution estimates in School-Z
Fig. Source profiles for apportionment of personal fine particulates School - X
SOURCE SOIL SIZE FINE SOURCE ROAD SIZE FINE 100.00000 100.00000 10.00000 10.00000 1.00000 1.00000 % 0.10000 % 0.10000 0.01000 0.01000 0.00100 0.00100 0.00010 PM5 CA NA LI NI PB CR HG FE MG K ZN CD MN AS UNDV 0.00010 PM5 CA NA LI NI PB CR HG Source Profile FE MG K ZN CD MN AS UNDV Source Profile Fig. Continued…. School - Y
Fig. Continued…. School - Z
Results and Discussion • Higher contribution from road traffic dusts and Indoors in case of School-Y • Close proximity of National Highway with dense traffic and poor ventilation is responsible for higher contribution. • Subjects of science discipline have shown more prone towards indoors • Major dominating source is ambient-outdoor in School-X due to steel plant emissions down wind location • Moderate ventilation and soil based dusty school play ground close to school building is attribute major contribution from ambient-outdoor and soils. • Indoor source is dominating due to higher stay time in labs for • Science discipline subjects. • Negligible contribution from soils and ambient-outdoor
References • Duan, N., 1980, ‘Microenvironment Types: a model for Human Exposure to Air Pollution’, (SIMS Technical Report), Standard, USA, Department of Statistics, Stanford University. • EPA, 2004. Fourth External Review Draft of Air Quality Criteria for Particulate Matter (June 2003). EPA/600/P-99/002Ad, Environmental Protection Agency, Research Triangle Park A.C. • EPA,1991, “ Introduction to Indoor Air Quality : A Reference Manual.” United State Environmental Protection Agency, United State Public Health Service, National Environmental Health Association, USA, EPA/400/3-91/003. • Evans, G., Highsmith, R. V., Sheldon,L. S., Suggs, J. C., Willams, R. W., Zweidinger, R. B., Creason, J. P., Walsh, D., Rodes, C. E., Lawless, P. A.,2000. The 1999 Fresno particulate matter exposure studies: comparison of community, outdoor and residential PM mass measurements. Journals of Air Waste Management Association. 50: 1887-1896. • Gajghate, D. G., and Hassan, M. Z., 1999. Ambient lead levels in urban areas. Bulletin of Environmental contamination and Toxicology. 62, 403-404. • Goel, P. K. and Trivedi, R.K., 1998. An Introduction to Air Pollution, Techno science Publications, Jaipur. • Kulkarni, M. M., and Patil, R. S., Monitoring of Daily Integrated Exposure of outdoor workers to Respirable Particulate Matter in an Urban Region of India, 1997.