Download
1 / 26
270 likes | 290 Views
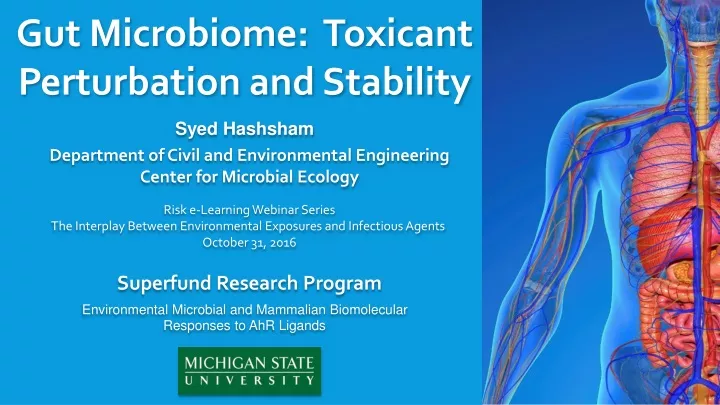
Gut Microbiome: Toxicant Perturbation and Stability. Syed Hashsham. Department of Civil and Environmental Engineering Center for Microbial Ecology. Risk e-Learning Webinar Series The Interplay Between Environmental Exposures and Infectious Agents October 31, 2016.

E N D
Gut Microbiome: Toxicant Perturbation and Stability Syed Hashsham Department of Civil and Environmental Engineering Center for Microbial Ecology Risk e-Learning Webinar Series The Interplay Between Environmental Exposures and Infectious Agents October 31, 2016 Superfund Research Program Environmental Microbial and Mammalian Biomolecular Responses to AhR Ligands
Outline • Gut Microbiome • Background and Objective • Treg/Th17 system, TCDD, and SFB • Hypothesis and Experimental Details • Results • B. Key Challenges Ahead • Communication channels • Predictive capabilities • Markers/Gut chips • Interventions • C. Summary
Gut Microbiome: Diseases & Interventions Diseases Allergies Asthma Anxiety Autism Autoimmune Cardiovascular Crohn’s Depression IBD Mood Disorder Migraine Multiple Sclerosis NAFLD Obesity Parkinson's Spinal Cord Injury Stroke Type 2 Diabetes Organs Brain Mouth Heart Kidney Liver Immune System Colon Tissue Muscle Host Gut Microbiome Interventions Fecal Transplant Psychobiotics Pre- and Probiotics Antibiotics Food Habits CRISPR Phage Commensals Keystone Species Opportunistic Pathogens Pathobionts Pathogens ENVRIONMENAL EXPOSURE Toxicants
Objective: Characterize the effect of specific gut microbiome members on Treg/Th17 System with and without TCDD Treg/Th17 (Host) Segmented Filamentous Bacteria (SFB) Bacteroides fragilis 2,3,7,8-TCDD (Toxicant) (Key Gut Members)
With TCDD, AhR promotes Treg and suppresses Th17 Naïve T cells IL-6 IL-6 Th17 aids in antimicrobial response; also causes inflammation & autoimmune disease Treg modulates and abrogates autoimmune disease Th17 Treg RORgt Foxp3+ Aryl hydrocarbon Receptor (AhR) IL-17 IL-22 IL-10 2,3,7,8-TCDD
Why Segmented Filamentous Bacteria (SFB)? • Obligate symbiont • Extensive auxotroph • No genes for amino acids, vitamins/cofactors, nucleic acids • Host-specific SFB in humans? CandidatusSavagella | Environmental Microbiology14 (6): 1462-2920 | 2012 2015 SFB cultivation is now possible using TC7 cell lines (BioTechniques, 59 (2):94–98, 2015 Dig Dis Sci. 60(10): 2953-62 SFB in patients by qPCR. Less in IBD constipated, and more in IBD diarrhea. 2013 Yin et al., ISME Journal 251 humans: majority colonized between ages 2 to 3 2013 Hans Jonsson 2009 Snel et al. Ivanov et al., Cell: 2009
Gut Clostridia B. fragilis Segmented Filamentous Bacteria (SFB) SFB Polysaccharide A Short Chain Fatty Acids Lamina propria Butyrate Dendritic cells Naïve T cells IL-6 IL-6 microRNAs Th17 Treg RORgt Foxp3+ Aryl Hydrocarbon Receptor (AhR) IL-21R Nos2 IL-21 IL-10 Host TCDD
Hypothesis TCDD exposure disrupts the Treg /Th17 system and specific gut microbial members are capable of preventing this disruption.
Two Possibilities! TCDD impacts the gut microbiome which then impacts host TCDD Clostridia B. fragilis SFB SCFA PSA TCDD impacts the host which then impacts the gut microbiome
Experimental Details C57BL6 Key measurements Gnotobiotic Traditional • TCDD: 30 µg/kg every 4 d • 56 d study • 4 per group • GF • SFB • B. fragilis • B. fragilis +SFB TCDD: 0.01 to 30 µg/kg every 4 d 30 d study 120 d study (90 d + 30 d recovery) 8 per group Cage separation • mRNA expression of ileal immunology genes (nCounter: 547 Immunology gene targets) • T-cells in blood/spleen (Flow cytometry) • microRNA expression in ileum (nCounter: 600 mouse microRNAs) Tim Zacharewski’s Lab UM Germ-Free Facility Fecal pellets, ilium, cecum, blood • High Throughput (Wafergen) or qPCR Fecal pellets, cecum
Gnotobiotic C57BL6: Gene Expression Ileum With TCDD Compared to GF Up-regulation Up-regulation Down-regulation Down-regulation With TCDD, SFB has more Down-regulated genes. Compared to GF, SFB has more Up-regulated genes.
Gnotobiotic C57BL6: Treg Spleen p =0.35 Colonization TCDD Vehicle p<0.0001 TCDD Normalized count Vehicle TCDD Parametric two-way ANOVA
Gnotobiotic C57BL6: Th17 Spleen Ciita was similar! IL1-b Vehicle p = 0.0004 Colonization p = 0.0196 TCDD TCDD Normalized count Normalized count Vehicle TCDD Parametric two-way ANOVA
Gnotobiotic C57BL6: B. fragilis and SFB B. fragilis SFB p=0.029 p=0.038
Traditional C57BL6: Dose Response & Recovery Day 38 90 120
Clostridia B. fragilis Overall Interaction of TCDD, B. fragilis, and SFB Polysaccharide A Butyrate Decrease in B. fragilis & Clostridia Gut Segmented Filamentous Bacteria (SFB) Increase in SFB SFB Dendritic cells Lamina propria (Expected change in SFB was an INCREASE) (Expected change in B. fragilis & Clostridia was a DECREASE) Naïve T cells IL-6 IL-6 Th17 Treg RORgt Foxp3+ AhR IL-21R Nos2 IL1-b IL-10 Host TCDD TCDD
Traditional C57BL6: Increase in Antimicrobial Resistance Genes
B. Key Challenges Ahead Identity Who is there? Who is doing what and how? Can we predict gut behavior? Quantitatively? How do we know when something is wrong? How to stop or encourage key members? Activity Prediction Diagnosis Intervention
2. Who is doing what and how? microRNA expression in SFB-associated mice is much greater than Germ-free or B. fragilis-associated groups! Ivanov et al., Cell: 2009 Spatial resolution More sensitive to work with 1-10 µl blood At all molecular levels MicroRNAs may alter the gut microbiota through fecal microRNAs, affecting growth and other cellular processes (Liu et al., 2016). Ileum
3. Can we predict the gut behavior – quantitatively? MDSINE Perturbation Gut Disruption Index Response Envelope Time series Biomass Perturbation Resistance: Maximum deviation from the pre-perturbed equilibrium VRE vs. E. faecium Halpin et al, Am. J. Infection Control 44 (2016) 830-6 Generalized Lota Volterra Model Response Resilience: Inverse of time taken to return to equilibrium Trajectories Interactions Stability Keystone-ness Disease-specific 1 Bucci et al. Genome Biology 17:121, 2016 Deterministic Probabilistic Time Hashsham et al., Fernandez et al., AEM, 2000
4a. How do we know when something is wrong? Markers Carbohydrates Functions, Guilds Acetyl-CoA Functional Gene Diversity Primer Coverage Butyrate producers Roseburia intestinalis Faecalibacterium prausnitzii …. Butyryl-CoA Fish et al., Front. Microbiol. 4: 291 2013 Butyryl-CoA acetate transferase BUT Butyrate kinase BUK Vital et al., mBio, 2014 Butyrate
4b. How do we know when something is wrong? Gut Chips Illumina Amplification-based qPCR or Low-density Chips Hybridization-based Arrays High Throughput Sequencing HuMiChip (500 functional genes, 180,000 probes) HuGChip (66 families, 4000 probes) IBS/IBD Chip (300 bacteria, 54 probes) Numerous but most focused on 16S rRNA gene based Fluidigm (24 primer sets) GULDA (Gut Low Density Array): 31 targets
Summary • TCDD and SFB/B. fragilis interact through AhR in a predictable manner in terms of immune cell response. Such interactions may establish the basis for intervention. • Measuring smaller effects of toxicants on gut microbiome members through the host may be difficult. • Gut member activity, mode of communication with the host, quantitative predictive models, and markers of healthy/sick gut microbiome are some of the key challenges ahead in gut microbiome research.
Gut Microbiome Play Store App Store Feedback: hashshamlab@gmail.com
Acknowledgements Research Supported by National Institutes of Environmental Health Sciences (2P42ES004911) Co-PIs & Collaborators James Tiedje, Norb Kaminski, Tim Zacharewski, Gerben Zylstra, James Cole, Benli Chai, and Brad Upham Robert Stedtfeld, Maggie Williams, Robert Crawford, Tiffany Stedtfeld, Shao Xiangwen, Prianca Bhaduri, and Kelly Fader Gnotobiotic study was conducted at the University of Michigan’s Germ-Free facility with Dr. Kathryn Eaton. SFB source: Candidatus ArthromitusSFB-mouse-Japan was provided by Dr. Tomomi Kuwahara under MTA.