Evolutionary Processes in Populations
390 likes | 417 Views
Explore the types of selection, sources of variation, causes of microevolution, and sources of stability in populations. Learn how natural selection impacts allele frequencies, and discover the importance of the Hardy-Weinberg equilibrium. Dive into directional, diversifying, stabilizing, and sexual selection, and understand how genetic drift, natural selection, gene flow, and mutations influence microevolution. Gain insights into the evolution of populations and the factors driving genetic diversity. Discover how populations evolve over time and the role of selective forces in shaping diverse traits. All this and more in a comprehensive study of evolutionary processes in populations.

Evolutionary Processes in Populations
E N D
Presentation Transcript
Topics: • Types of Selection • Sources of Variation in a Population • Causes of Microevolution • Sources of Stability in Populations • Hardy-Weinberg Equilibrium
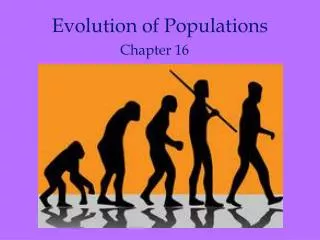
One obstacle to understanding evolution is the common misconceptionthat organisms evolve, in a Darwinian sense, in their lifetimes. Natural selection does act on individuals by impacting their chances of survival and their reproductive success. However, the evolutionary impact of natural selection is only apparent in tracking how a population of organisms changes over time. It is the population, not its individuals, that evolves. Introduction
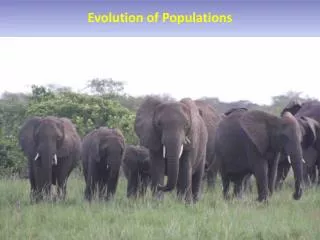
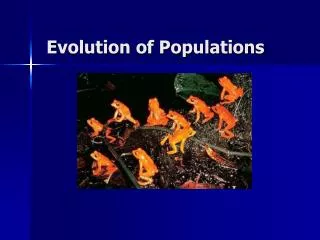
Evolution on the scale of populations, called microevolution, is defined as a change in the allele frequencies in a population. Macroevolution leads to Speciation. For example, the bent grass (Argrostis tenuis) in this photo is growingon the tailings ofan abandoned mine,rich in toxicheavy metals. Individual plants do not evolve to become more metal-tolerant during their lifetimes.
A population is a localized group of individuals that belong to the same species. One definition of a species (among others) is a group of populations whose individuals have the potential to interbreed and produce fertile offspring in a nature. A population’s gene pool is defined by its allele frequencies
The total aggregate of genes in a population at any one time is called the population’s gene pool. It consists of all alleles at all gene loci in all individuals of a population.
Types of Selection Review of natural selection
Types of selection • Directional Selection • Diversifying Selection (Disruptive) • Stabilizing Selection • Sexual Selection Animation
Directional Selection • Changing environmental conditions give rise to directional selection, where one phenotype replaces another in the gene pool. • Can produce rapid shift in allelic frequencies. • Ex: Peppered moth – peppered moths, pesticide resistance, antibiotic resistance Occur in response to/when: * in response to directional change in the environment * in response to one or more new environmental conditions * when mutation appears and proves to be adaptive
Diversifying (Disruptive) Selection • Increases the extreme types in a population at the expense of the intermediate forms. • One population divided into two. (bill size in seedcrackers)
Diversifying selection can result in balanced polymorphism. For example, two distinct bill types are present in black-bellied seedcrackers in which larger-billed birds are more efficient when feeding on hard seeds and smaller-billed birds are more efficient when feeding on soft seeds.
Stabilizing Selection • Intermediate forms of a trait are favored and alleles that specify extreme forms are eliminated from a pop. • Ex: Human birth weight stay between 6-8 lbs. Lower or higher has higher mortality. Class Quiz
Sexual Selection • Sexual dimorphism – when sexually reproducing species have a distinctly male or female phenotype (Ex. Peacocks) • Sexual selection comes into play when certain traits are advantageous simply because males or females prefer them. • Coloration, strength- other “mate attractants” • Females are the main agents of selection here
Sources of Variation in a Population
-Causes of Microevolution
Four factors can alter the allele frequencies in a population: genetic drift natural selection gene flow mutation All represent departures from the conditions required for the Hardy-Weinberg equilibrium. The two main causes of microevolution are genetic drift and natural selection Overview Clip
Causes of microevolution loss of genetic diversity Genetic Drift Genetic Drift Short Clip • EVOLUTION BY CHANCE • A random change in allele frequencies over generations, brought about by chance alone. • Impact minor in large pops, but significant in small pops. • In the absence of other forces, random change in allele frequencies leads to the homozygous condition and a loss of genetic diversity over the generations.(This happens in all pops; it just happens faster in small ones.) • Genetic drift is pronounced when very few individuals rebuild a pop or found a new one – get a BOTTLENECK: (a severe reduction in pop size, due to intense selection pressure or natural calamity)– founder effect is one type of bottleneck. • Inbreeding – form of genetic drift in a small population. ANIMATION
The bottleneck effect occurs when the numbers of individuals in a larger population are drastically reduced by a disaster. By chance, some alleles may be overrepresented and others underrepresented among the survivors. Some alleles may be eliminated altogether. Genetic drift will continue to impact the gene pool until the population is large enough to minimize the impact . Genetic Drift Causes of microevolution
Bottlenecking is an important concept in conservation biology of endangered species. Populations that have suffered bottleneck incidents have lost at least some alleles from the gene pool. This reduces individual variation and adaptability. For example, the genetic variation in the three small surviving wild populations of cheetahs is very low when compared to other mammals. Their genetic variation is similar to highly inbred lab mice. Causes of microevolution Genetic Drift Causes of microevolution
An example of a bottleneck: Northern elephant seals have reduced genetic variation probably because of a population bottleneck humans inflicted on them in the 1890s. Hunting reduced their population size to as few as 20 individuals at the end of the 19th century. Their population has since rebounded to over 30,000—but their genes still carry the marks of this bottleneck: they have much less genetic variation than a population of southern elephant seals that was not so intensely hunted. Genetic Drift Causes of microevolution
The founder effect occurs when a new population is started by only a few individuals that do not represent the gene pool of the larger source population. At an extreme, a population could be started by single pregnant female or single seed with only a tiny fraction of the genetic variation of the source population. Genetic drift would continue from generation to generation until the population grew large enough for sampling errors to be minimal. Founder effects have been demonstrated in human populations that started from a small group of colonists. Causes of microevolution Genetic Drift
Gene Flow Causes of microevolution Gene Flow Animation • Gene flow is the physical flow of alleles into or out of a population. Immigration – alleles coming in (added) Emigration – alleles moving out (lost) • Gene flow counteracts differences that arise through mutation, natural selection, and genetic drift. • Gene flow helps keep separated populations genetically similar.
Causes of microevolution Gene Flow Gene flow tends to reduce differences between populations. • If extensive enough, gene flow can combine neighboring populations into a single population with a common genetic structure. • The migration of people throughout the world is transferring alleles between populations that were once isolated, increasing gene flow.
Mutation Causes of microevolution Mutation • Amutation is a change in an organism’s DNA. • A new mutation that is transmitted in gametes can immediately change the gene pool of a population by substituting the mutated allele for the older allele. • For any single locus, mutation alone does not have much quantitative effect on a large population in a single generation. • An individual mutant allele may have greater impacts later through increases in its relative frequencies as a result of natural selection or genetic drift.
Causes of microevolution Mutation • While mutations at an individual locus are a rare event, the cumulative impact of mutations at all loci can be significant. • Each individual has thousands of genes, any one of which could experience a mutation. • Populations are composed of thousands or millions of individuals that may have experienced mutations. • Over the long term, mutation is a very important to evolution because it is the original source of genetic variation that serves as the raw material for natural selection. Clip: Review of factors that contribute to gene pool change. (warning…cheesy but good info
Frequency Dependent Selection • Preserves Variety • Also called “minority advantage” • Acts to decrease the frequency of the more common phenotype and increase frequency of the less common one. • EX: Sometimes predators tend to concentrate on common varieties of prey and overlook rare ones. Within prey species, this could result in the fitness of each variety being inversely related to its frequency in the population. • could maintain polymorphism
Sources of Stability in Populations *Hardy-Weinberg Equilibrium*
Allows us to calculate the frequencies of alleles in a population
The Hardy-Weinberg theorem describes the gene pool of a nonevolvingpopulation. This theorem states that the frequencies of alleles and genotypes in a population’s gene pool will remain constant over generations unless acted upon by agents other than Mendelian segregation and recombination of alleles. The Hardy-Weinberg Theorem describes a nonevolving population
Allele Frequencies • Allele frequencies: the abundance of each kind of allele in a population. • To compare, use Hardy-Weinberg equilibrium: p2= frequency of homo dom 2pq = frequency of hetero q2 = frequency of homo recess p2 + 2pq + q2 = 1
p + q = 1 p2 + 2pq + q2 = 1 • Consider a population whose gene pool contains the alleles A and a. • Hardy and Weinberg assigned the letter p to the frequency of the dominant allele A and the letter q to the frequency of the recessive allele a. • Since the sum of all the alleles must equal 100%, then p + q = 1.
They then reasoned that all the randompossible combinations of the members of a population would equal • (p+q)2 • or p2 + 2pq + q2 p + q = 1 p2 + 2pq + q2 = 1
The frequencies of A & a will remain unchanged generation after generation if the following conditions are met: 1. Large population. -The population must be large to minimize random sampling errors. 2. Random mating. -There is no mating preference. For example an AA male does not prefer an aa female. (NO SEXUAL SELECTION) 3. No mutation. -The alleles must not change. 4. No migration. -Exchange of genes between the population and another population must not occur. 5. No natural selection. -Natural selection must not favor any particular individual.
Example problem:1 in 1700 US Caucasian newborns have cystic fibrous.(C for normal is dominant over c for cystic fibrous).1-What percent of the population have cystic fibrous. 2-What percent of the population are carriers? • HWE= p + q = 1orp2 + 2pq + q2 = 1 • Since we know cc= q2, calculate q2 • q2 =cc= 1/1700= 0.00059= 0.059% (Answer to #1) • c =√.00059 =0.024= 2.4% • So, the c allele frequency is 2.4% • Now, Calculate C allele • HWE= p + q= 1 • So, p= 1-q • p= 1- .024 • p= 0.976 or 97.6 % We still haven’t answered question #2
p = 0.976 or 97.6 % q = 0.024 or 2.4% HWE= p2 + 2pq + q2 = 1 2pq= Heterozygous condition (carriers) 2pq= 2 (0.976 x 0.024) 2pq= 0.0468 or 4.68% of US Caucasians are carriers. (Answer to #2) Example problem:1 in 1700 US Caucasian newborns have cystic fibrous.(C for normal is dominant over c for cystic fibrous).1-What percent of the population have cystic fibrous. (0.059%)2-What percent of the population are carriers? (4.68%)
If 9 percent of the population has blue eyes, what percent is hybrid for brown eyes? Homozygous for brown eyes? Practice Problem: • q2 = 9% = 0.09 (convert to decimal) • Solve for q: q = 0.3 • Solve for p: • p + q = 1 ; p = 1-0.3 ; p= 0.7 • Solve for 2pq; 2(0.7 x 0.3)= 42% are hybrid • Solve for p2: • p2 = (.7)2 =49% are homozygous dominant.
This is a classic data set on wing coloration in the scarlet tiger moth (Panaxia dominula). Coloration in this species had been previously shown to behave as a single-locus, two-allele system with incomplete dominance. Data for 1612 individuals are given below: White-spotted (AA) =1469 Intermediate (Aa) = 138 Little spotting (aa) =5 What are the frequencies of the A & a alleles? Practice Problem: A = (2 * (1469) + (138))/(2 * (1469 + 138 + 5)) = .954 or 95.4% a = 1 - .954 = .046 or 4.6% AA = (.954) 2 = .910 or 91% Aa = 2 (.954)(.046) = .087 or 8.7% aa = (.046) 2 = .002 or .2%
It is the changes in gene frequencies over time that result in evolution.