Download
1 / 28
280 likes | 389 Views
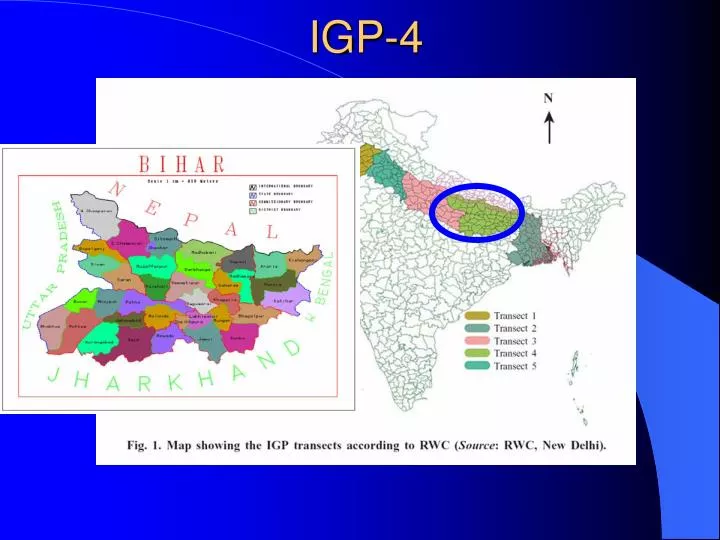
IGP-4. Low productivity (Rice-Wheat 4-5 t/ha) - low to medium potential Poor investment in infrastructure Medium-high precipitation High potential for cold water fisheries and livestock Degradation of Land and water resources Deficient human capital combined with high out-migration

E N D
Low productivity (Rice-Wheat 4-5 t/ha) - low to medium potential • Poor investment in infrastructure • Medium-high precipitation • High potential for cold water fisheries and livestock • Degradation of Land and water resources • Deficient human capital combined with high out-migration • Downstream environmental constraints • Low population density
Low Productivity (4-8 t/ha) - Food deficit region • Low investment in infrastructure • Low inputs of fertilizer and water • Medium - High rainfall, More per capita water availability • Underutilization of ground water (< 20 %) • Very few developed irrigation network • Coastal salinity and sea water intrusion • Moderate water quality hazards • High risk of flooding, poor drainage and moderate drought • Out-migration of labour to other regions • High population density • High Productivity (R-W: 8-12 t/ha) - Food surplus region • High investment in infrastructure • Major inputs of fertilizer and water • Low - Medium rainfall, Low per capita water availability • Over exploitation of ground water (>80 %) • Well developed irrigated network • Secondary salinization • Severe ground water quality hazards • Severe to moderate drought prone areas • In-migration of labour • Medium-high population density
AGRICULTURE PROFILE OF THE STATE : AT A GLANCE Geographical location Latitude 21º58’10” North to 27º31’15” North Longitude 83º19’15” East to 88º17’40” East Elevation from Sea level 53 meter Total geographical area of the State is 93.60 lakh hect. Land use classification of the State is given below :- Lakh hect. (i) Forest 6.16 (ii) Barren & non-cultivatable land 4.37 (iii) Land put to non-agriculture uses 16.35 (iv) Cultural Waste land 0.48 (v) Permanent pasture 0.18 (vi) Area under misc. Crops 2.30 (vii) Other fallow (2 to 5 years) 1.41 (viii) Current fallow 5.95 (ix) Net area sown 56.38 (x) Total cropped area 80.26 (xi) Area sown more than once 23.58 (xii) Density of population 884/sq. km.
Low level of Input Use(Per Hectare consumption of fertilizer)
Low level of Procurement of Foodgrain(Unit : In Thousand MT)
Crops Particulars 1980-90 1990-99 1980-99 Rice Area 0.56 -0.89 -0.56 Production 4.06 6.75 2.87 Yield 3.48 7.71 3.45 Wheat Area 1.01 3.13 4.38 Production 3.74 4.92 2.15 Yield 2.70 1.74 0.72 Maize Area -2.65 3.70 0.72 Production 3.83 3.13 5.42 Yield 6.66 -0.55 4.66 Potato Area 0.88 1.58 1.30 Production 3.17 -1.75 2.05 Yield 2.27 -3.29 0.74 Sugarcane Area 0.68 -1.63 0.41 Production 6.23 -5.03 2.51 Yield 5.50 -3.45 2.09 Moong Area 1.40 -2.49 -0.16 Production 0.54 -3.46 -0.58 Yield -0.85 -0.99 -0.42 Pigeonpea Area -4.80 -0.98 -2.87 Production -2.87 -4.04 -3.20 Yield 2.03 -3.08 -0.34 Growth rates of major crops in Bihar (Area in 000'ha, Production in MT and Yield in Tonnes /ha.)
Agroclimatic zones of Bihar The state falls in the middle-Gangetic plains region. It is sub-divided into three agro-ecological sub-zones. These are, Northwest Alluvial Plains (Zone-I). North-East Alluvial Plains (Zone-11) and South Bihar Alluvial Plains (Zone-Ill A and III B).
Ground water resources and Irrigation potential in Bihar (1995) SI. No Particulars Zone-I Zone-H Zone-Ill Bihar 1. Total Ground water resources (MCM) 10714.15 6544.33 10791.46 26049.94 2. Utilizable groundwater resources (MCM 9107.34 5562.72 9323.77 23993.83 3. Net Annual Draft (MCM) 2414.85 1093.72 1837.28 5345.85 4. Ground water Balance (MCM) 6692.49 5459.00 7486.49 18647.98 5. Stage of Ground water development and category 56.51 (White) 19.66 (White) 19.70 (White) 22.28 (White) 6. Net Irrigation requirement (M) 0.65 0.65 0.45 1.75 7. Potential created upto March' 95 371510 170537 389198 931243 8. Additional Irrigation after full exploitation (ha) 1029575 705981 1670023 3405579 9. Ultimate Irrigation potential 1401085 876518 205922 4336824
SI. No. Source Zone-I Zone-II Zone-III Bihar 1. Canal 277.26 (20.49) 159.79 (17.17) 840.77 (37.35) 1277.82 (28.18) 2. Ponds & Tanks 102.24 (7.56) 5.63 (0.60) 38.3 (1.7) 146.17 (3.22) 3. Electric tube wells 56.47 (4.17) 15.31 (1.65) 309.85 (13.77) 381.64 (8.64) 4. Diesel tube wells 801.59 (59.24) 687.62 (73.90) 561.26 (24.94) 2050.47 (45.22) 5. Wells 7.33 (0.54) 1.44 (0.15) 15.82 (0.70) 24.58 (0.54) 6. Other sources 108.26 (8.0) 60.72 (6.53) 484.86) (21.54 653.84 (14.42) 7. Gross Irrigated Area 1353.16 930.51 2250.86 4534.52 Zone-wise and source-wise Gross Irrigated Area in Bihar ( Year -1998 ) (Area in 'OOOha)
Agro-ecological Zone Geographical Area Net sown Area Cropping Intensity Rainfall Soils and topography Population density Animal density Literacy Poverty I 3261 2153 142.17 1122 Heavy textured sandy loam to clayey, medium, acidic, flood prone. 1073 2.73 45.20 50.83 II 1986 1255 158.43 1387 Light to medium textured slightly acidic, sandy loam to salty clay loam with saline/ alkaline patches. 518 1.52 37.98 53.35 III 4112 2195 135.11 1104 Old alluvium sandy loam to clayey, large tal and Diara area. Slightly alkaline patches. 1065 3.83 55.01 42.07 Bihar 9360 5603 143.05 1234 880 2.83 47.42 48.05 Agro-ecological characteristics of Bihar (Area in '000 ha.)
SI. No. AES Soil characteristics Principal crops as % of gross cropped area in the AES Major cropping system 1 AES-I Tal land Heavy soils, clay loam to clay in texture. Deep cracking in summers. Maize-1.2 Paddy-0.1 Lentil 70.08 Gram- 2.6 Oilseed-5.3 Wheat-9.2 Lathyrus-10.3 Fallow-Lentil Fallow-Gram Fallow-Lathyrus Fallow- Oilseeds Fallow-Wheat Maize / Paddy-Wheat 2 AES-II Diara land Rain fed /irrigated light soils (Sandy loam to loam). Maize -50.5 Arhar-9.7 Cucurbits-15.3 Wheat-45.3 Maize-21.8 Potato-12.6 Vegetable-5.2 Linseed- 3.2 Maize-Wheat-Fallow Maize-Potato-Fallow Maize-Vegetable-Cucurbits Cucurbits-Wheat Cucurbits-Maize-Oilseeds 3 AES-III Jalla land Medium heavy to heavy soils, clay loam to clay in texture. Paddy-20.1 Maize-10.3 Vegetables-8.8 Wheat-20.2 Lentil-19.8 Gram-10.3 Onion-40.5 Potato-35.2 Paddy-Wheat-Onion Maize-Potato-Onion Vegetable-Wheat-Onion Paddy-Gram-Potato 4 AES-IV Irrigated plains Medium to heavy soil. Rice -95.2 Wheat-35.33 Lathyrus- 9.73 Gram-3.32 Lentil-25.52 Potato-12.36 Vegetable-1.36 Maize-2.88 Linseed-1.3 6 Mustard-1.2 Baseem-2.5 Pea-5.0 Paddy-Wheat Paddy-Lathyrus Paddy-Potato-Moong Paddy-Wheat-Paddy Fallow-Potato-Paddy Maize-Oilseed-Vegetable Vegetable-Wheat-Vegetable Paddy-Berseem 5 AES-V Rainfed plains Medium to heavy soil. Rice-95.0 Wheat-50.5 Lathyrus- 2.3 Gram-3.7 Lentil-39.7 Maize-2.7 Linseed-1.2 Mustard-2.7 Paddy-Wheat Paddy-Lentil/ Gram / Lathyrus Paddy-Maize Paddy-Mustard Paddy-Linseed Summary of agro-ecological situations of Patna District
Sl. No Subdivisions Blocks attached to them 1. Patna Sadar Patna Sadar, Phulwarisharif, Sampatchak 2. Patna City Fatuha, Khusrupur, Daniyanvan 3. Danapur Danapur. Bihta, Maner, Naubatpur 4. Masaurhi Masaurhi, Dhanarua. Punpun 5. Paliganj Bikram, Dulhinbazar, Paliganj 6. Barh Bakhtiarpur, Athamalgola, Belchi, Pandarak, Barh, Mokama,Ghoswari. Administrative setup of Patna district
5 AES of Patna District Agro-ecologically South Bihar Alluvial Plains Zone III B is spread south of river Ganga. Physiographically it is almost plain alluvium, but to the south of the natural levee of Ganga, there is a parallel stretch of Diara land receiving flash floods. At the eastern end of the district there are stretches of Tal lands where backwaters of Ganga River stagnate in low lands during Kharif season floods, between September-December every year. Tal lands extend from Fatuha to Mokameh blocks in the district, where most natural drainage systems, i.e., rivers from south, simply vanish.
SI. No. Block Tal Land Diara Land Jalla Land Irrigated Land Unirrigated Land Total Cultivated AES-I AES-II AES-III AES-IV AES-V Area 1 Patna Sadar Nil 277.00 2108.50 Nil Nil 23285.50 2 Phulwarisharif Nil Nil Nil 4485.00 3798.44 8283.44 3 Faluha Nil 1840.00 1400.00 2000.00 15523.62 20763.62 4 Masaurahi Nil Nil Nil 4000.00 13168.28 17168.28 5 Dhanarua Nil Nil Nil 1200.00 11291.59 12491.59 6 Punpun Nil Nil Nil 1300.00 6739.75 8039.75 7 Danapur Nil 1242.06 Nil 1420.70 1579.30 4242.06 8 Maner Nil 4392.30 Nil 2170.40 4417.30 10980.00 9 Bihta Nil Nil Nil 7025.60 4941.44 11967.04 10 Bikram Nil Nil Nil 17008.39 3450.49 20458.88 11 Paliganj Nil Nil Nil 13560.33 5811.57 19371.90 12 Naubatpur Nil Nil Nil 10166.82 4357.21 14524.03 13 Barh 4972.09 1364.93 Nil 3900.00 3412.35 13649.37 14 Bakhliarpur 3855.80 2142.11 Nil 2000.00 570.55 8568.46 15 Pandarak 7219.60 1666.06 Nil 1300.00 921.42 11107.08 16 Mokameh 10261.57 3420.52 Nil (2400.00) 3420.54 17102.63 17 Patna District 30209.06 16344.98 3508.50 67637.24 83403.85 201103.63 Block wise Cultivated Area (Ha.) in Different AES of Patna District (in ha.) (2001-02)
Tal : • Low-lying area separated from the river Ganga by its natural levee. • Inundated on the onset of monsoons, as the riverbed swells with the backwaters of the river pond in this area. • After late September, the water starts receding from higher reaches and drains completely by the middle of December. • The soils are grey, medium heavy-to-heavy in texture, very poor in drainage and crack widely on drying. • Major crops during Rabi season crops like lentil, and gram with no crop possible during Kharif due to submergence. • The cultivated land under this segment is 30209.06 ha., contributing 15.02 % land to the district.
Diara • Natural levees of river Ganga or its abandoned channels nearby. • These are subject to flash floods during monsoons, resulting in either erosion or deposition of soil every year. • Soil is light in colour and texture, well drained and crops are mostly taken during Rabi. • Choice of Kharif (liable to be washed off) and summer (mostly vegetables) crops depend upon type of Diara. Enterprising farmers are developing irrigation facilities on stable Diaras for crops and some have even gone for orchards like mango, guava etc. • Parval is an important vegetable crop among cucurbits and farmers are earning from selling its root cuttings as planting material. • This area is about 16344.98 ha., in the district contributing 8.12 % to the cultivated land.
Jalla • These are similar to Tal lands, but are a bit shallower, getting partial and short duration inundation in parts by the river Punpun and its tributaries. • Due to its proximity to Patna town, it also receives drainage water of the city. • Though it is highly fertile, it carries some harmful chemicals along with heavy metals that enter the food chain. • This area is mostly known for its vegetable cultivation besides pulses and more recently for potato and onion. • This constitutes only 1.74 % (i.e., 3508.50 ha.,) of cultivated area in the district.
Irrigated Plains • These areas have assured irrigation facilities either through Sone command system or through state or private owned tubewells. • This part of the district has good, well-drained soils and the farmers follow predominantly Rice-Wheat rotation. • The private tubewell owners seldom irrigate rice crop. Some vegetables, spices and flowers are also grown in this area. • The cultivated area under this AES is 67637.24 ha., constituting 33.63 % of the net cultivated area. • Although this area is most affected by extremism and class wars, it has the highest potential in terms of number of enterprises possible.
Rainfed plains • These have climate and soils similar to irrigated plains and mainly follow the same cropping sequence by and large but they lack assured irrigation facility. • Availability of water mostly decides the choice of Rabi crops. • This covers a significant 83403.85 ha., i.e., 41.47 percent of the cultivated area. • The AES has immense scope for diversification.