Download
1 / 17
170 likes | 283 Views
Forecasting Magnitude from Fault Geometry Bill Ellsworth, USGS Menlo Park, CA. Magnitude – Area Relations M = log(A) + k. Wells and Coppersmith (W&C, 1994) widely used in hazard analysis. Good agreement between W&C and kinematic rupture models derived from seismic waves.

E N D
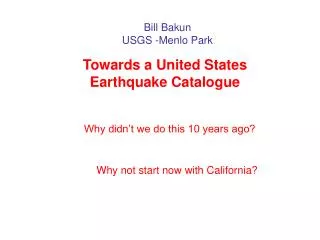
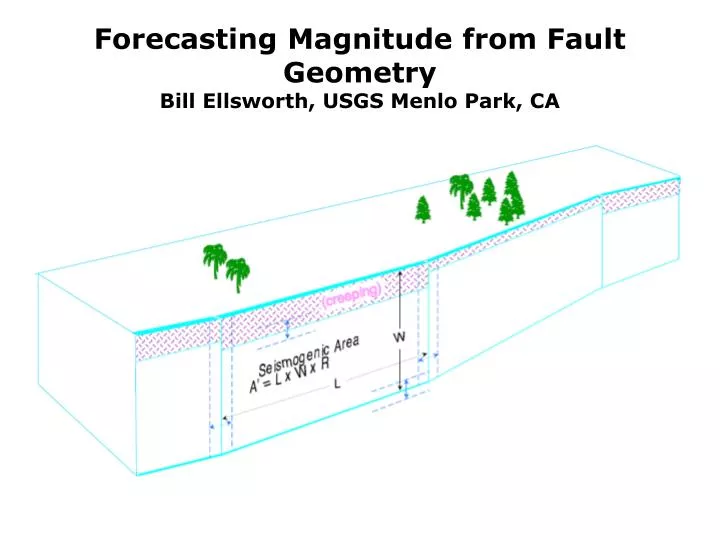
Forecasting Magnitude from Fault GeometryBill Ellsworth, USGS Menlo Park, CA
Magnitude – Area RelationsM = log(A) + k • Wells and Coppersmith (W&C, 1994) widely used in hazard analysis. • Good agreement between W&C and kinematic rupture models derived from seismic waves. • Application of W&C to WG02 fault model overpredicts historical seismicity rate. • WG02 adopted 3 relations for large earthquakes: M = 3.98 + 1.02 log(A) (W&C) M = 4.2 + log(A) (Ellsworth) M = 3.03 + 4/3 log(A) (Hanks & Bakun) where A = Length x Width x R (seismic coupling factor)
Magnitude – Area RelationsM = log(LWR) + k • Length (L): easy • Width (W): difficult; disagreement between seismic and geodetic rupture models • Aseismic slip factor (R): shallow creep – do-able; brittle-ductile transition – hard • Trade-off between W and R: M = log(L) + log(WR) + k
Seismologists observe the coseismic rupture M = log(LW) + k
Forecast models must account for the total slip budget M = log(LWR) + k
In this example R = 0.7 or log(R) = -0.15
If the coseismic rupture is described by M = log(LW) + 4.0 the forecast rupture is M = log(LWR) + 4.15
WG02 Approach to Determining W and R Define W as the depth of the brittle-ductile transition determined from seismicity and thermal data Use geodetic data to determine R given W
Depth of Seismicity and Depth to Brittle-Ductile transition in the San Francisco Bay AreaColin Williams USGS, Menlo Park
WG02 Fault L, W and R Values R factor accounts for creep but not for aseismic slip at the brittle-ductile transition If great earthquakes rupture into the brittle-ductile transition W and R will be incorrect
Near-Fault Displacements from GPS Survey and Rupture Depth of a Uniform Dislocation Fault displacement vectors along the Trans-Alaskan Pipeline Best model: 5.95 m slip from 0 to 11.6 km
Comparing Depth of Rupture EstimatesObtained from Geodesy and Seismology Depth range of geodetic models Depth range of seismic rupture models
Concluding Remarks • Different approaches to the definition of W lead to different M(A) relations. • The trade-off between W and R will be difficult to resolve with available data. • The discrepancy between M(A) relations derived from earthquake slip models and those derived from earthquake cycle considerations can be explained by the R-factor. • If rupture in large magnitude earthquakes routinely extends below the depth of complete locking the R-value in the current Working Group model will need to be modified if the W&C relation is used.