Download
1 / 43
430 likes | 549 Views
Comparing Computational Algorithms for Modeling Phoneme Learning. Ilana Heintz, Fangfang Li, and Jeff Holliday The Ohio State University MCWOP 2008, University of Minnesota. Research Questions. How do children learn to discriminate between similar phonemic categories?

E N D
Comparing Computational Algorithms for Modeling Phoneme Learning Ilana Heintz, Fangfang Li, and Jeff Holliday The Ohio State University MCWOP 2008, University of Minnesota
Research Questions • How do children learn to discriminate between similar phonemic categories? • How does adult feedback affect that process? • How are adults able to understand children? • In what ways exactly is child speech different from adult speech?
Narrowing it Down • How do children learn the difference between close consonants, for instance, /s/ vs. /S/ vs. /c}/ • What are the differences in the productions of each of these consonants? • How do the consonants differ across languages? • How do children’s productions differ from adult speech?
Modeled data • Stimuli elicited by 160 children and 37 adults • 3 word tokens per CV type, 1390 total stimuli • Children aged 2-5 from America, Japan, and Songyuan, China (Mandarin speaking) • Stimuli later used in perception tests with adults, here we only study the production data
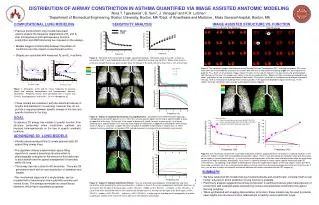
1876 1876 Frequency (Hz) 1643 1643 Frequency (Hz) Frequency (Hz) Frequency (Hz) Sound pressure level (dB/Hz) Sound pressure level (dB/Hz) Hand-measured acoustic analyses
As reported in Li 2008 Hand-measured acoustic analyses
These are great results…so why use computational methods? • Automatically derive many features per stimulus • Derive time-varying features across the stimulus • Look at more interactions between features • Build a model that can be used to talk about acquisition & feedback
E,J,M /s/ English /S/, Japanese /c}/, Mandarin /S/ Self-organizing maps: a result
Setting up the Map • Determine dimensionality of data: • 4 variables • Independent or correlated • Data represented by four-dimensional numeric vector: • [100.23, 233.76, 202.21, 4.3] • Neurons same dimensionality as data • Determine number of neurons: 15 x 15
E,J,M /s/ English /S/, Japanese /c}/, Mandarin /S/ All adult speakers Self-organizing maps:distance matrix
E,J,M /s/ Mandarin /S/, Japanese /c}/ All adult speakers Self-organizing maps:Best-matching units, labeled
/s/ /S/ English-speaking adults English adults only
/s/ /c}/ Japanese-speaking adults Japanese-speaking adults Japanese adults only
Mandarin-speaking adults Mandarin adults only /s/ /S/ /c}/
/s/ /S/ English-speaking children: all English-speaking children
/s/ /S/ English-child data shown on English-adult map Child-produced data on adult-trained map
/s/ /S/ English-speaking children: 2-year-olds English-speaking 2-year-olds
/s/ /S/ English-speaking children: 3-year-olds English-speaking 3-year olds
/s/ /S/ English-speaking children: 4-year-olds English-speaking 4-year-olds
/s/ /S/ English-speaking children: 5-year-olds English-speaking 5-year-olds
Conclusions • Partially replicated some of the results of the hand-measured acoustic analysis with self-organizing maps • Summing over four frequency regions of excitation pattern mirrored centroid results • Less than 1390 stimuli split into 10 ms frames was enough to train 15 x 15 maps
More to do… • Find better features for Mandarin, Japanese • Incorporate dynamic features into the map • Study the childrens’ productions more closely • Incorporate notion of feedback by connecting the children and adult maps with Hebbian updates
References • Cabrera, D., Ferguson, S. and Schubert, E. 2007. “PsySound3: Software for acoustical and psychoacoustical analysis of sound recordings.” Proceedings of The 13th International Conference on Auditory Display. Montreal Canada. pp. 356-363 . • Glasberg, B.R and Moore, C.J. 2002. “A model of loudness applicable to time-varying sounds.” Journal of the Audio Engineering Society. 50:5, 331-342. • Kohonen, T. 1995. "Self-Organizing Map", 2nd ed., Springer-Verlag, Berlin. 160-161. • Li, Fangfang. 2008. “Universal Development in Context: the Case of Child Acquisition of Sounds Across Languages.” Lecture, University of Lethbridge. • Vesanto J., Himberg J., Alhoniemi E., Parhankangas J. 1999. “Self-organizing map in Matlab: the SOM Toolbox.” In Proceedings of the Matlab DSP Conference 1999, pages 35-40.