Download
1 / 10
100 likes | 317 Views
Climatology of the Río de la Plata Basin: short and long term variability . Mario Bidegain Facultad de Ciencias Universidad de la Republica Uruguay. Workshop on Soil moisture variability in the Rio de la Plata Basin: Assesment.

E N D
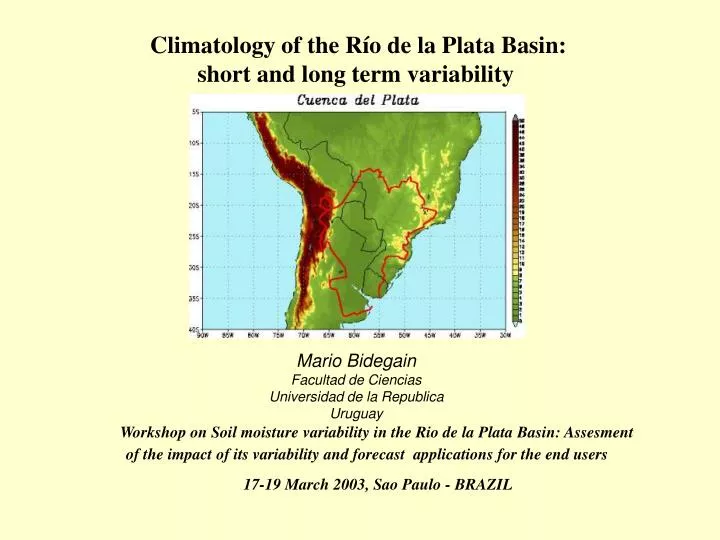
Climatology of the Río de la Plata Basin: short and long term variability Mario Bidegain Facultad de Ciencias Universidad de la Republica Uruguay Workshop on Soil moisture variability in the Rio de la Plata Basin: Assesment of the impact of its variability and forecast applications for the end users 17-19 March 2003, Sao Paulo - BRAZIL
Annual Precipitation La Plata Basin • Annual mean precipitation is about 1100 mm • Annual mean precipitation decrease from north to south and east to west • From 1800 mm in the uplands between Argentina and Brazil to 150 mm in Bolivia • The amplitude of annual cycle decrease from north to south. The northern part has a well-defined annual cycle with maximum precipitacion during summer. The central region has a uniform seasonal distribution, with maxima during spring and autumn • (VAMOS Scientific Group, 2001)
Monthly mean precipitation La Plata Basin • Around 20-25° (eastern part of basin) enhanced summer precipitation is signature of SACZ • In winter and spring (southern part of basin) enhanced rainfall is signature of increased baroclinic activity • In summer enhanced rainfall (see january) in the northern part of basin is signature of South American moonson (ICZ) • (VAMOS Scientific Group, 2001)
Interannual variability of precipitation: ENSO events (Warm events) • Several studies have found links between ENSO events in the Pacific Ocean and rainfall anomalies diring late austral spring-early summer. • Rainfall anomalies in northeastern Argentina, southeastern Brazil and Uruguay tend to be positive from November (El Nino year) to February (next year).
Variability of precipitation associated to ENSO phases (Cold events) • Rainfall anomalies in northeastern Argentina, southeastern Brazil and Uruguay tend to be negative from July to December (Nina year) and from March to May (next year). • These rainfall anomalies during ENSO events are associated with atmospheric circulation anomalies. Over most of southeastern South America in spring during warm (cold) ENSO events the subtropical jet and cyclonic activity are enhanced (weakened).
Decadal variability of precipitation • The strongest interdecadal variability in the annual cycle of precipitation occurs in regions of transition between precipitation regimes • In subtropical Argentina the annual precipitation shows oscillations from 7 to 10 years • Precipitation trends in Argentina and Uruguay have been positive since 1916 and even increased after the late sixties • Precipitation increased by up to 30% between 1960 and 2000 in several localities between 20° and 35° S east of Andes
Annual mean temperature La Plata basin • Annual mean temperature range from 16°C in the south to 25° in the northeast. • The higher altitudes in the eastern part of the Brazilian states of Sao Paulo, Parana and Santa Catarina are more cooler than their surroundings. • The western part of basin receives the influence of persistent meridional winds (from north) and is more warmer than surroundings. • In winter the monthly mean temperature have a clear north-south gradient. In summer the gradient is more zonal reacting to the land ocean distribution
Diferences between rainfall estimations from 3 GCMs and observations (mm/day) ECHAM4 (1991-99) CSIRO (1961-99) HADCM3 (1950-99)
WHY ACTIONS RELATED TO MONITORING AND PREDICTION OF SOIL MOISTURE? • To improve weather and climate forecasts (interactions between surface-atmosphere). • To improve streamflow estimations • Better estimation of water needs for crops and pastures.