Download
1 / 34
340 likes | 480 Views
Effects of Urban-Influenced Thunderstorms on Atmospheric Chemistry. Kenneth E. Pickering Department of Meteorology University of Maryland HEAT Planning Workshop March 15, 2004. Outline. Background – chemical measurements, modeling for deep convection, urban plumes, lightning NO x

E N D
Effects of Urban-Influenced Thunderstorms on Atmospheric Chemistry Kenneth E. Pickering Department of Meteorology University of Maryland HEAT Planning Workshop March 15, 2004
Outline • Background – chemical measurements, modeling for deep convection, urban plumes, lightning NOx • HEAT – proposed objectives, measurements, modeling strategies • Possible activities
Effects of Deep Convection - Venting of boundary layer pollution - Transport of NOx, NMHCs, CO, and HOx precursors to upper troposphere - Downward transport of cleaner air - Transported pollutants allow efficient ozone production in upper troposphere - Results in enhanced upper tropospheric ozone production over broad regions • Increased potential for intercontinental transport - Enhanced radiative forcing by ozone
Effects of Deep Convection - Lightning production of NO - Perturbation of photolysis rates - Effective wet scavenging of soluble species - Incorporation of pollution aerosols into precipitation processes - Nucleation of particles in convective outflow - In remote regions low values of O3 and NOx are transported to upper troposphere - Larger values of these species tranported to PBL where they can more readily be destroyed
Aircraft Measurements of Trace Gas Redistribution in Oklahoma PRESTORM June 15, 1985 MCC CO O3 Dickerson et al., 1987, Science
Kansas-Oklahoma Squall Line Cell Goddard Cumulus Ensemble (GCE) Model with offline tracer transport
June 10-11 PRESTORM Initial Conditions AltitudeCO (ppbv)O3(ppbv)NOx(pptv) 0-1.75 km 150 (245) 28 (64) 900 (2950) 1.75-2.5 135 28 607 2.5-5.0 106 35 280 5.0-8.1 67 43 97 8.1-10.3 76 60 218 10.3-trop. 65 75 308 Urban BL values in parentheses Pickering et al. (1992) Representative of ~45 km downwind of Oklahoma City
Vertically-averaged Ozone Production in Cloud Outflow June 10-11 PRESTORM (4-15 km) Cloud- UndisturbedProcessed Rural air 2.7 5.7 - 6.2 Urban plume 2.7 9.4 - 9.9 Values in ppbv/day Pickering et al. (1992)
LW Radiative Forcing - Clouds LW Radiative Forcing - Clear
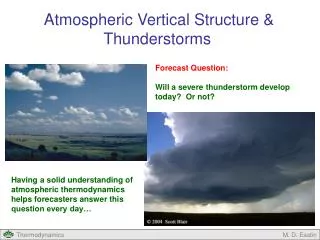
The effect of thunderstorms on local O3 can be remarkable even at periphery of storm.
On the third day of a high O3 episode (June 24-26 1998), a line of thunderstorms passed just north of the Fair Hill, MD monitor.
Production of NO by Lightning - Global production estimates range from 2 to 20 Tg N/yr due to uncertainty in global flash rate and in the production per flash • Global flash rate estimated from OTD satellite measurement ~44 flashes/s (Christian et al., 2003) • Production per flash estimated from analysis of NO spikes in aircraft measurements, cloud-scale chemical transport modeling, or mass flux techniques • Cloud-scale chemical transport models represent lightning either through explicit electrophysics or use of observed/parameterized flashes • Models addressing other important questions: production per CG flash vs. production per IC flash; vertical distribution of lightning NOx at storm dissipation
Cloud-scale Chemical Model Results - July 12, 1996 Transport Only – No chemistry or NO from Lightning DeCaria et al., 2000
CG: 460 CG: 460 IC: 345 IC:46 Moles NO Per Flash CG: 460 CG: 460 IC: 460 IC: 690 Model-simulated vs. Measured NOx Profiles For Four Lightning NO Production Scenarios DeCaria et al. (2000) For a 30-km flash, 460 moles NO/flash ~ 1 x 10²² molec/m
Ozone Production for 24 hours Following Storm 42 x 42 km anvil region Entire model domain
EULINOX - July 21, 1998 a. b. (Huntrieser et al., 2002).
1630 UTC 1653 UTC Original Cell Cell Splitting 1803 UTC 1734 UTC Multicellular Supercell (Höller et al., 2000).
PCG = PIC = 250 moles/flash gives best agreement with Falcon measurements at 8.5 km of mean NOx ~ 3 ppbv
With 3 ppbv NOx in UT, ozone production is less efficient than in STERAO-A case with ~1.2 ppbv Max. ΔP(O3) ~4 ppbv versus ~10 ppbv in STERAO-A case
HEAT Objectives Characterize and quantify convective transport of urban pollution from BL to UT Quantify lightning production of NOx Examine effects on UT chemistry (e.g., O3, HOx production)
Objective 1 – Convective Transport • Study transport and fate of urban pollutants • Examine relative importance of convective motions, scavenging, and chemistry • Measurements required – vertical profiles of chemical mixing ratios before, during and after storm (CO, NO, NOx, NOy, O3, SO2, HOx, HC, peroxides, aldehydes, acetone, aerosols) • Characterize inflow, outflow, and storm core (?) • U. of WY King Air – low level inflow, outflow • WMI Lear Jet – anvil outflow • Chemical analysis of precip from mesonet • CO, CO2 as tracers of air motion in storm
Objective 2: Production of Lightning NOx • Quantify amount of NO produced per flash, per meter of flash channel, per thunderstorm, by different storm types • Quantify amount produced by an IC flash vs. that produced by a CG flash and by different components of a flash • Measurements required – NO, NOx, NOy in low level inflow/outflow, in anvil outflow, and in storm core (?). Channel lengths and distributions from lightning mapping system, CG flashes from NLDN • Analysis of flash and aircraft NO spike meas.; chemical transport modeling; mass flux analysis
Objective 3: Effects on UT Chemistry • Examine effects of combination of pollution and lightning NOx on UT O3 and HOx chemistry • Quantify relative contributions of boundary layer and lightning NOx to UT NOx mixing ratios • Chemical transport modeling required • To verify these models, chemical measurements needed in convective outflow plumes hours to days downstream
Possible Post-Mission Analysis and Modeling Activities • Analysis of relationships between flash data and observed NO spikes • Cloud-resolving model simulations of chemical transport, wet scavenging, lightning NO production (parameterized, explicit); comparisons with measurements and between models • Tests of convective transport and lightning parameterizations in regional models; calculation of downstream ozone production