Download

1 / 16
160 likes | 345 Views
TPC ExB distortion at LHC-ALICE experiment. Yasuto Hori for the ALICE-TPC collaboration Center for Nuclear Study, University of Tokyo. Outline. Introduction: ALICE-TPC and ExB distortion Calculation technique of ExB distortion Many kinds of ExB distortion ExB Twist distortion

E N D
TPC ExBdistortion at LHC-ALICE experiment Yasuto Hori for the ALICE-TPC collaboration Center for Nuclear Study, University of Tokyo
Outline • Introduction: ALICE-TPC and ExB distortion • Calculation technique of ExB distortion • Many kinds of ExBdistortion • ExB Twist distortion • Summary and Outlook
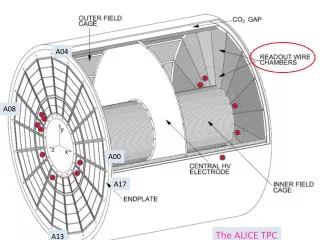
Overview of ALICE-TPC gy B field UV Laser tracks in TPC drift volume z gx E field IP beam 100kV A side ROC C side (muon-side) ROC • Main central tracking device • diameter x length = 5 m x 5 m,|h| < 0.9, 2pazimuthal coverage • Max drift length ~ 2.5 m, Central electrode ~100kV E ~ 400V/cm • gas Ne-CO2-N2(85.7%:9.5%:4.8%) • low diffusion & high drift velocity(drift time 92msec), • but strong temperature dependent drift velocity • temperature stability & homogenity < 0.1K cooling system and P,T monitor • UV laser system used for drift velocity, ExB, alignment
ExBdistortion in ALICE-TPC • Electrons are drifted at the E field direction if ExB is zero. • If ExB is non-zero Space point distortion on the Pad plane • (or x-y, r- phi) occurs • This distortion may degrade DCA-to-Vertex distribution, • DCA-btw-2tracks distribution, • ITS-TPC matching efficiency,.. Gating Grid wire Track E &B field Drift electrons Distorted drift electron Pad plane
Calculation technique via Langevin equation • Langevin eq. which describes this distortion can be decomposed • into E field part and B field part if Ez≫ Er,Ef& Bz≫ Br,Bf • We have to know parameter T1, T2 of Ne:CO2:N2 Next slide Decompose + wt tensor Steady-state langevineq Space point distortion E field distortion B field distortion
T1, T2 extraction via Laser track distortion with Gating Grid Voltage (GGV) Scan Procedure Calibrate Voltage at GG plane by measuring C1&C0 using B=0 laser tracks ( C1&C0 must be 0 & 1 at B=0 ) 2. Measure change of track distortion with GGV scan at B=5kGaus 3. Compare with calculation using T1 and T2 T1 = 1.0 +- 0.1, T2=1.0 +-0.3 is obtained! T1 = 1.0 T2 = 1.0 GGV= 10 V drf [cm] Distortion change [cm] Z [cm] Radi [cm] Zigzag pattern of Real data is from Pad geometry Radi [cm]
ExBdistortion Sources and Models • B field non-uniformity • B field is measured, non-zero Br, Bf, corrected to ~0.3mm • Twist between E and B field axis • TPC is tilted from the B field axis • E field distortion by misalignment of TPC components • (field cage, each rod, ROC, central electrode ) • GGV Error from normal setting • E field distortion because of space charge drf [mm] dr [mm] R [cm] Z [cm] gY [cm] gX [cm] B field TPC Next 3 slides E field
Twist between E and B axis • space point distortion∝ drift length and angle between E and B axis • track distortion is similar to translation, but A side track is • translated to the opposite direction of C side track translation Value to be measured dr [cm] Zdrift = 250 cm Z[cm] R [cm] gY[cm] gX[cm] Zdrift = 250 cm drf[cm] gY[cm] R [cm] Z[cm] gX[cm]
A/C vertex shift due to ExB Twist • By ExB Twist Distortion, x-y position of vertex reconstructed by only • A side tracks is shifted from that of only C side tracks Distorted A track Original track Distorted C track fast simulation full simulation (small statistics) TPC pad plane A/C Vertex shift Inner wall Outer wall A/C vertex shift is almost proportional to Twist angle !!
Twist angles extraction and verification at p+p collision data B positive data B negative data A Vertex C Vertex Primary Vertex A vertex C vertex C vertex A vertex • A/C vertex shift can be found at pp collision data! • Position of A /C vertex are swapped with B field polarity • Primary vertex (by ITS&TPC all tracks) lays on the middle of the A/C vertex • Twist angles are extracted and verified !!
Summary and Outlook • We construct framework for calculation of ExB distortion • T1&T2 values are extracted by Laser track distortion with GGV scan • List up many kinds of ExB distortion • ExB distortion due to B non-uniformity is already corrected • ExB Twist distortion is measured via A/C vertex shift in p+p collision • real data • measure A/C ROC rotation and translation, which causes A/C vertex • shift • estimate how Rods shift (dominant part of E field distortion) causes • A/C vertex shift • finalize Twist angles • ExB due to E field distortion like Rods shift, … • Space charge at PbPb collision data
T1, T2 parameters measurement via Laser track distortion with Gating Grid Voltage (GGV) Scan 1 • Change Gating Grid Voltage from normal setting ~ 70Volt • Change “effective” voltage at GG plane • “effective” means that voltage at GG plane depend on GGV setting • itself as well as E field leakage from under GG plane • E field distortion change • ExB space point distortion change, which can be observed by laser tracks • and calculated using T1 and T2 parameters T1 = 1.0 T2 = 1.0 GGV= 10 V drf [cm] Distortion change [cm] Z [cm] Radi [cm] Zigzag pattern of Real data is from Pad geometry Radi [cm]
T1, T2 parameters measurement via Laser track distortion with Gating Grid Voltage (GGV) Scan 2 • “effective” voltage at GG plane can be • calculated by garfield simulation • GGVeff [V] = 0.9175*GGVsetting[V]+ 3.91 • This can be confirmed by measuring C0 & C1 • value at B=0 data, which must be 1 & 0 • Reasonable agreement (left chi2 plot) • With above relation, • T1&T2 values are extracted by B=5kGaus laser data • T1= 1.0 +- 0.1 • T2= 1.0 +- 0.3 • Good agreement with • garfield simulation
With Old corr. With New corr. Sigma of DCA-to-Vertex distribution with 2 sets of correction parameters. Black line is almost consistent to MC 16