Download
1 / 28
360 likes | 1.55k Views
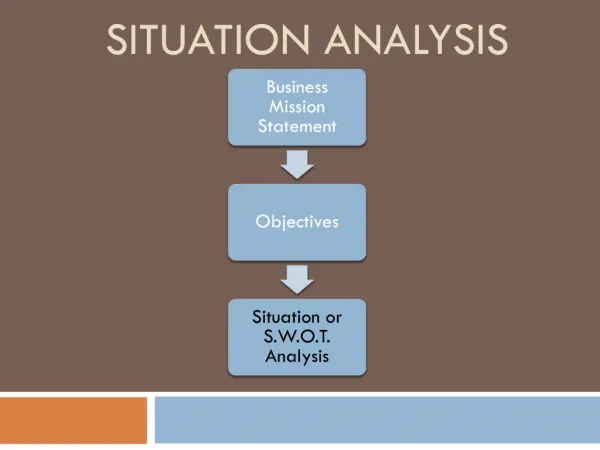
Topic: Marketing Situation Analysis. I. SITUATION ANALYSIS. Marketing & Promo Mix Consumer / Market / Environment Competitive Situation Marketing / Advertising Objectives Creative Strategy.

E N D
Topic: Marketing Situation Analysis I. SITUATION ANALYSIS • Marketing & Promo Mix • Consumer / Market / Environment • Competitive Situation • Marketing / Advertising Objectives • Creative Strategy Note: Only B (excl. environment) & C will be discussed in the slides following. This power-point slides are intended for students who haven’t completed Com 352 and provide a review of some basic knowledge concerning situation analysis. Handouts are available for the asking.
Topic: Marketing Situation Analysis B. Consumer, Market, Environment B. Consumer, Market, Environment 1. Market (Geographic) Analysis 2. Consumer (Demography, Usage) Analysis 3. Environmental (Constraint) Analysis
Topic: Marketing Situation Analysis B. Consumer, Market, Environment Market Analysis Sales Potential Indicators:CDI& BDI • When market sales data are available: CDI = % of CategorySales / % of Persons BDI = / % of Persons % of BrandSales
Topic: Marketing Situation Analysis B. Consumer, Market, Environment Market Analysis Sales Potential Indicators:CDI& BDI • When market sales data are NOT available: CDI = % of CategoryUsers / % of Persons BDI = / % of Persons % of BrandUsers
Topic: Marketing Situation Analysis B. Consumer, Market, Environment 1. Market Analysis How are CDI/BDI used? Simple scenario approach
Topic: Marketing Situation Analysis B. Consumer, Market, Environment 1. Market Analysis How are CDI/BDI used? Other Weighting Approaches • Equal weights: .5BDI + .5CDI • Unequal Weights (examples): • .75BDI + .25CDI • .33BDI + .67CDI Note: BDI/CDI are only two of many indicators of market potential and thus used with other market indicators in media/target decisions
Topic: Marketing Situation Analysis B. Consumer, Market, Environment 1. Market Analysis Example 2 (see handout):CDI& BDI 1.78 = CDI Setl. = X 100 191 .93 1.56 = BDI setl. = X 100 168 .93 • What do CDI and BDI for Seattle indicate about its market potential?
Topic: Marketing Situation Analysis B. Consumer, Market, Environment 1. Market Analysis Example 2:CDI& BDI 2.82 = CDI S.F. = X 100 167 1.69 3.0 = BDI S.F.. = X 100 178 1.69 • What do CDI and BDI for S.F. indicate about its market potential?
Topic: Marketing Situation Analysis B. Consumer, Market, Environment 1. Market Analysis Example 2: CDI and BDI With equal weights given: .5BDI + .5CDI • Seattle = .5 X 168 + .5 X 191 = 180 • San Francisco = .5 X 178 + .5 X 167 = 153 Note: Based on the BDI and CDI alone, you will choose Seattle to spend surplus ad budget.
Topic: Marketing Situation Analysis B. Consumer, Market, Environment 1. Market Analysis Example 2: CDI and BDI With unequal weights given: .75BDI + .25CDI • Seattle = .75 X 168 + .25 X 191 = • San Francisco = .75 X 178 + .25 X 167 = Note: With the BDI and CDI weighted unequally, you will choose San Francisco to spend surplus ad budget.
Topic 2: Marketing Situation Analysis B. Consumer, Market, Environment Market Analysis Sales Potential Indicators:CDI& BDI • When market sales data are not available: (case for your project) BDI = % ofBrandUsers / % of Persons OR # of B.Usersin Market / # of B. Users in Population = X 100 # of Persons in Market / # of Persons in Population
Topic 2: Marketing Situation Analysis B. Consumer, Market, Environment Market Analysis Sales Potential Indicators:CDI& BDI • When sales data are available by geo market: BDI % ofBrandSales / % of Persons = OR B. Sales ($) in Market / B. Sales in U.S. = X 100 # of Persons in Market / # of Persons in US
Topic 2: Marketing Situation Analysis B. Consumer, Market, Environment Market Analysis Sales Potential Indicators:CDI& BDI • When data are not available: CDI = % of Category Users / % of Persons OR / # of C. Users in US # of C. Users in Market = X 100 # of Persons in Market / # of Persons in US
Topic: Marketing Situation Analysis B. Consumer, Market, Environment 2. Consumer Analysis Sales Potential Indicators: CDI & BDI • When sales data are available by consumer segment: CDI = % of Persons % of CategorySales / BDI = % of BrandSales / % of Persons
Topic: Marketing Situation Analysis B. Consumer, Market, Environment 2. Consumer Analysis: Sales Potential Indicators –CDI, BDI • When sales data are NOT available Note: Sales potential indicators, CDI or BDI, are derived from MRI or Simmons data which report the product or brand usage index in ‘D’ column CDI = % of Persons % of CategoryUsers / BDI = % of BrandUsers / % of Persons
Topic: Marketing Situation Analysis B. Consumer, Market, Environment 2. Consumer Analysis: Sales Potential Indicators –CDI, BDI • MRI Index (for Category)-- E.g., age 18-24 % of All Persons = % ofAllCategory Users / # of C. Usersin 18-24 / # of C. Users in All ages = X 100 # of Persons in 18-24 / # of Persons in All ages
Topic: Marketing Situation Analysis B. Consumer, Market, Environment 2. Consumer Analysis: Sales Potential Indicators –CDI, BDI • MRI Index (for Brand): E.g., age 18-24 % of All Persons = % ofAllBrand Users / # of B.Usersin 18-24 / # of B.Users in All ages = X 100 # of Persons in 18-24 / # of Persons in All ages
Topic: Marketing Situation Analysis B. Consumer, Market, Environment 2. Consumer Analysis: • How Is MRI/Simmons Index used? - Does the segment with the highest index have the greatest sales volume potential? • Why or why not? Example: Index Age 18-24 25-34 35-44 % Users 17 18 33 % Pop 13 20 36 Calculation (17/13)X100 (18/20)X100 (33/36)X100 131 90 92
Topic: Marketing Situation Analysis B. Consumer, Market, Environment 2. Consumer Analysis • How consumer segments should be analyzed for sales volume potential: ---Use User Size and Index; Weigh UserSize by Index to determine volume potential (value) of segment .17 X 131 = 22.3 Volume Potential18-24 = Volume Potential35-44 = .33 X 92 = 30.4 Note: the volume potential above is not actual sales volume but estimated composite weight that takes on meaning only when compared to other composite weights
Topic: Marketing Situation Analysis C. Competitive Assessment:3 Components 1.Market shares for all direct and indirect competitors 2. Competitive (and your) media mix and expenditure (in $ and % of their budget) 3.Share-of-Voice or Ad Share (brand’s expenditure as % of all brands’ spending
Topic: Marketing Situation Analysis C. Competitive Assessment 1. Competition & Market Shares • For your project, Use LNA/Media Watch Data for competitive mix & expenditure and SOV • Our library has 1994 data (Jan-Sept), UCLA, management library has 1999 data.
Topic: Marketing Situation Analysis C. Competitive Assessment 1. Competition & Market Shares • Direct Competition: • Indirect Competition Brands in the same product class as yours; e.g., Brands in one or more different product classes; e.g.,
Topic: Marketing Situation Analysis C. Competitive Assessment 2. Media Mix & Expenditure(2 tables or 1 combined table) • Raw Expenditures Table -- to show, for each competitor (& you): What media types have been used and how much ($) has been spent in each of the media? • Media Proportion Table What percent of the brand budget is spent in each medium? Note: the two tables above may be combined into one as in the LNA exercise provided
Topic: Marketing Situation Analysis C. Competitive Assessment 2. Media Mix and Expenditure < Two Tables Combined: Example 1>
Topic: Marketing Situation Analysis C. Competitive Assessment 2. Media Mix and Expenditure <Combined Table: Example 2>
Topic: Marketing Situation Analysis C. Competitive Assessment 3. Share-of-voice or Ad Share(in %) • Overall: SOV = Brand Y’s total $ x 100______ All Competitors or Brands total $ • In Each Medium: SOV = Brand Y’s $ in medium x 100______ All Competitors or Brands total $ in medium
Topic: Marketing Situation Analysis C. Competitive Assessment 3. Share-of-Voice (SOV) Example (see handout) • SOV Sealy/Overall = (29,851.6 / 58,222.4) x 100 = 51.3 % • SOV Sealy/Mag = (316.4 / 9,307.4) x 100 = 3.4 %
Topic: Marketing Situation Analysis C. Competitive Assessment Guidelines in Assessing Competitive Efforts 1) From competitive media mix table, determine what media have been used heavily and what rarely, and consider their implications for your own media mix -- what media must be used and why and assess threats and/or opportunities that might exist in the use of certain media 2) From SOV analysis, assess your strengths/weaknesses against the competition, and see if any change in the mix and/or increase or decrease in spending for certain media is warranted for an effective media mix for your brand. Example: LNA Exercise #4