Download
1 / 65
650 likes | 866 Views
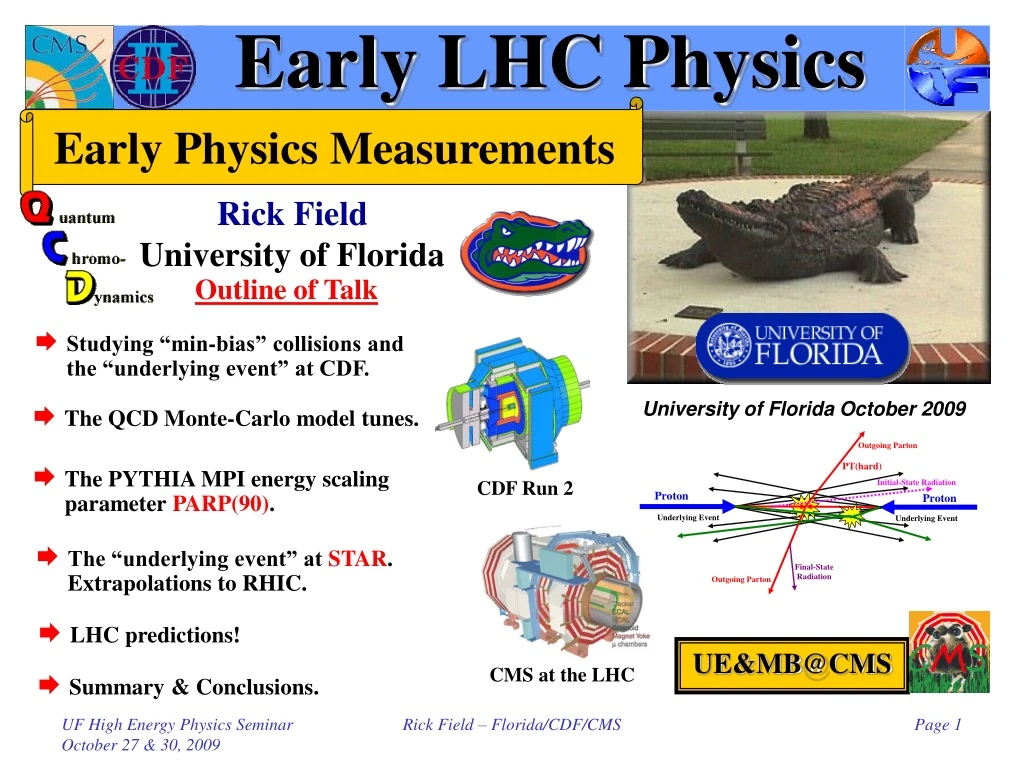
Early LHC Physics. Early Physics Measurements. Rick Field University of Florida. Outline of Talk. Studying “min-bias” collisions and the “underlying event” at CDF. University of Florida October 2009. The QCD Monte-Carlo model tunes. The PYTHIA MPI energy scaling parameter PARP(90).

E N D
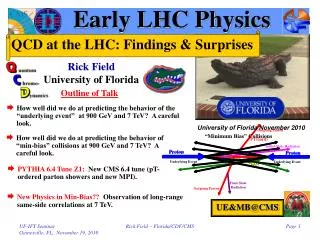
Early LHC Physics Early Physics Measurements Rick Field University of Florida Outline of Talk • Studying “min-bias” collisions and the “underlying event” at CDF. University of Florida October 2009 • The QCD Monte-Carlo model tunes. • The PYTHIA MPI energy scaling parameter PARP(90). CDF Run 2 • The “underlying event” at STAR. Extrapolations to RHIC. • LHC predictions! UE&MB@CMS CMS at the LHC • Summary & Conclusions. Rick Field – Florida/CDF/CMS
Proton-AntiProton Collisionsat the Tevatron The CDF “Min-Bias” trigger picks up most of the “hard core” cross-section plus a small amount of single & double diffraction. stot = sEL + sIN stot = sEL + sSD+sDD+sHC 1.8 TeV: 78mb = 18mb + 9mb + (4-7)mb + (47-44)mb CDF “Min-Bias” trigger 1 charged particle in forward BBC AND 1 charged particle in backward BBC The “hard core” component contains both “hard” and “soft” collisions. “Inelastic Non-Diffractive Component” Beam-Beam Counters 3.2 < |h| < 5.9 Rick Field – Florida/CDF/CMS
Inelastic Non-Diffractive Cross-Section • The inelastic non-diffractive cross section versus center-of-mass energy from PYTHIA (×1.2). My guess! Lots of events! Linear scale! Log scale! stot = sEL + sSD+sDD+sHC • sHC varies slowly. Only a 13% increase between 7 TeV (≈ 58 mb) and 14 teV (≈ 66 mb). Linear on a log scale! Rick Field – Florida/CDF/CMS
3 charged particles dNchg/dhdf = 3/4p = 0.24 1 charged particle Divide by 4p 1 GeV/c PTsum dNchg/dhdf = 1/4p = 0.08 3 GeV/c PTsum dPTsum/dhdf = 1/4p GeV/c = 0.08 GeV/c dPTsum/dhdf = 3/4p GeV/c = 0.24 GeV/c Particle Densities • Study the charged particles (pT > 0.5 GeV/c, |h| < 1) and form the charged particle density, dNchg/dhdf, and the charged scalar pT sum density, dPTsum/dhdf. Charged Particles pT > 0.5 GeV/c |h| < 1 CDF Run 2 “Min-Bias” DhDf = 4p = 12.6 Rick Field – Florida/CDF/CMS
CDF Run 1 “Min-Bias” DataCharged Particle Density • Shows CDF “Min-Bias” data on the number of charged particles per unit pseudo-rapidity at 630 and 1,800 GeV. There are about 4.2 charged particles per unit h in “Min-Bias” collisions at 1.8 TeV (|h| < 1, all pT). <dNchg/dh> = 4.2 <dNchg/dhdf> = 0.67 • Convert to charged particle density, dNchg/dhdf, by dividing by 2p. There are about 0.67 charged particles per unit h-f in “Min-Bias” collisions at 1.8 TeV (|h| < 1, all pT). 0.25 0.67 • There are about 0.25 charged particles per unit h-f in “Min-Bias” collisions at 1.96 TeV (|h| < 1, pT > 0.5 GeV/c). <dNchg/dh> = 1.6! Rick Field – Florida/CDF/CMS
“Hard Scattering” Component QCD Monte-Carlo Models:High Transverse Momentum Jets • Start with the perturbative 2-to-2 (or sometimes 2-to-3) parton-parton scattering and add initial and final-state gluon radiation (in the leading log approximation or modified leading log approximation). “Underlying Event” • The “underlying event” consists of the “beam-beam remnants” and from particles arising from soft or semi-soft multiple parton interactions (MPI). The “underlying event” is an unavoidable background to most collider observables and having good understand of it leads to more precise collider measurements! • Of course the outgoing colored partons fragment into hadron “jet” and inevitably “underlying event” observables receive contributions from initial and final-state radiation. Rick Field – Florida/CDF/CMS
Proton Proton Proton Proton MPI, Pile-Up, and Overlap MPI: Multiple Parton Interactions • MPI: Additional 2-to-2 parton-parton scatterings within a single hadron-hadron collision. Pile-Up Interaction Region Dz • Pile-Up: More than one hadron-hadron collision in the beam crossing. Overlap • Overlap: An experimental timing issue where a hadron-hadron collision from the next beam crossing gets included in the hadron-hadron collision from the current beam crossing because the next crossing happened before the event could be read out. Rick Field – Florida/CDF/CMS
CDF Run 1: Evolution of Charged Jets“Underlying Event” • Look at charged particle correlations in the azimuthal angle Df relative to the leading charged particle jet. • Define |Df| < 60o as “Toward”, 60o < |Df| < 120o as “Transverse”, and |Df| > 120o as “Away”. • All three regions have the same size in h-f space, DhxDf = 2x120o = 4p/3. Charged Particle Df Correlations PT > 0.5 GeV/c |h| < 1 Look at the charged particle density in the “transverse” region! “Transverse” region very sensitive to the “underlying event”! CDF Run 1 Analysis Rick Field – Florida/CDF/CMS
PYTHIA 6.206 Defaults MPI constant probability scattering • Plot shows the “Transverse” charged particle density versus PT(chgjet#1) compared to the QCD hard scattering predictions of PYTHIA 6.206 (PT(hard) > 0) using the default parameters for multiple parton interactions and CTEQ3L, CTEQ4L, and CTEQ5L. PYTHIA default parameters Default parameters give very poor description of the “underlying event”! Note Change PARP(67) = 4.0 (< 6.138) PARP(67) = 1.0 (> 6.138) Rick Field – Florida/CDF/CMS
Tuning PYTHIA:Multiple Parton Interaction Parameters Hard Core Determines the energy dependence of the MPI! Determine by comparing with 630 GeV data! Affects the amount of initial-state radiation! Take E0 = 1.8 TeV Reference point at 1.8 TeV Rick Field – Florida/CDF/CMS
Run 1 PYTHIA Tune A CDF Default! • Plot shows the “transverse” charged particle density versus PT(chgjet#1) compared to the QCD hard scattering predictions of two tuned versions of PYTHIA 6.206 (CTEQ5L, Set B (PARP(67)=1)andSet A(PARP(67)=4)). PYTHIA 6.206 CTEQ5L Run 1 Analysis Old PYTHIA default (more initial-state radiation) Old PYTHIA default (more initial-state radiation) New PYTHIA default (less initial-state radiation) New PYTHIA default (less initial-state radiation) Rick Field – Florida/CDF/CMS
Factor of 2! Run 1 Charged Particle Density“Transverse” pT Distribution • Compares the average “transverse” charge particle density with the average “Min-Bias” charge particle density (|h|<1, pT>0.5 GeV). Shows how the “transverse” charge particle density and the Min-Bias charge particle density is distributed in pT. PT(charged jet#1) > 30 GeV/c “Transverse” <dNchg/dhdf> = 0.56 “Min-Bias” CDF Run 1 Min-Bias data <dNchg/dhdf> = 0.25 Rick Field – Florida/CDF/CMS
CDF Run 1 Min-Bias “Associated”Charged Particle Density “Associated” densities do not include PTmax! Highest pT charged particle! • Use the maximum pT charged particle in the event, PTmax, to define a direction and look at the the “associated” density, dNchg/dhdf, in “min-bias” collisions (pT > 0.5 GeV/c, |h| < 1). It is more probable to find a particle accompanying PTmax than it is to find a particle in the central region! • Shows the data on the Df dependence of the “associated” charged particle density, dNchg/dhdf, for charged particles (pT > 0.5 GeV/c, |h| < 1, not including PTmax) relative to PTmax (rotated to 180o) for “min-bias” events. Also shown is the average charged particle density, dNchg/dhdf, for “min-bias” events. Rick Field – Florida/CDF/CMS
CDF Run 1 Min-Bias “Associated”Charged Particle Density Rapid rise in the particle density in the “transverse” region as PTmax increases! PTmax > 2.0 GeV/c Transverse Region Transverse Region Ave Min-Bias 0.25 per unit h-f PTmax > 0.5 GeV/c • Shows the data on the Df dependence of the “associated” charged particle density, dNchg/dhdf, for charged particles (pT > 0.5 GeV/c, |h| < 1, not including PTmax) relative to PTmax (rotated to 180o) for “min-bias” eventswith PTmax > 0.5, 1.0, and 2.0 GeV/c. • Shows “jet structure” in “min-bias” collisions (i.e.the “birth” of the leading two jets!). Rick Field – Florida/CDF/CMS
Min-Bias “Associated”Charged Particle Density • Shows the “associated” charged particle density in the “toward”, “away” and “transverse” regions as a function of PTmax for charged particles (pT > 0.5 GeV/c, |h| < 1, not including PTmax) for “min-bias” events at 1.96 TeVfrom PYTHIA Tune A (generator level). “Toward” Region ~ factor of 2! “Transverse” “Transverse” • Shows the Df dependence of the “associated” charged particle density, dNchg/dhdf, for charged particles (pT > 0.5 GeV/c, |h| < 1, not including PTmax) relative to PTmax (rotated to 180o) for “min-bias” events at 1.96 TeVwith PTmax > 0.5, 1.0, 2.0, 5.0, and 10.0 GeV/c from PYTHIA Tune A (generator level). Rick Field – Florida/CDF/CMS
“Transverse” Charged Density 0.6 • Shows the charged particle density in the “transverse” region for charged particles (pT > 0.5 GeV/c, |h| < 1) at 1.96 TeVas defined by PTmax, PT(chgjet#1), and PT(jet#1) from PYTHIATune Aat the particle level (i.e. generator level). Rick Field – Florida/CDF/CMS
PYTHIA Tune A Min-Bias“Soft” + ”Hard” Tuned to fit the CDF Run 1 “underlying event”! PYTHIA Tune A CDF Run 2 Default 12% of “Min-Bias” events have PT(hard) > 5 GeV/c! 1% of “Min-Bias” events have PT(hard) > 10 GeV/c! • PYTHIA regulates the perturbative 2-to-2 parton-parton cross sections with cut-off parameters which allows one to run with PT(hard) > 0. One can simulate both “hard” and “soft” collisions in one program. Lots of “hard” scattering in “Min-Bias” at the Tevatron! • The relative amount of “hard” versus “soft” depends on the cut-off and can be tuned. • This PYTHIA fit predicts that 12% of all “Min-Bias” events are a result of a hard 2-to-2 parton-parton scattering with PT(hard) > 5 GeV/c (1% with PT(hard) > 10 GeV/c)! Rick Field – Florida/CDF/CMS
The “Underlying Event” Select inelastic non-diffractive events that contain a hard scattering Hard parton-parton collisions is hard (pT > ≈2 GeV/c) “Semi-hard” parton-parton collision (pT < ≈2 GeV/c) The “underlying-event” (UE)! + + + … Given that you have one hard scattering it is more probable to have MPI! Hence, the UE has more activity than “min-bias”. Multiple-parton interactions (MPI)! Rick Field – Florida/CDF/CMS
The Inelastic Non-Diffractive Cross-Section Occasionally one of the parton-parton collisions is hard (pT > ≈2 GeV/c) Majority of “min-bias” events! “Semi-hard” parton-parton collision (pT < ≈2 GeV/c) + + + + … Multiple-parton interactions (MPI)! Rick Field – Florida/CDF/CMS
The “Underlying Event” Select inelastic non-diffractive events that contain a hard scattering Hard parton-parton collisions is hard (pT > ≈2 GeV/c) “Semi-hard” parton-parton collision (pT < ≈2 GeV/c) The “underlying-event” (UE)! + + + … Given that you have one hard scattering it is more probable to have MPI! Hence, the UE has more activity than “min-bias”. Multiple-parton interactions (MPI)! Rick Field – Florida/CDF/CMS
Charged Particle Multiplicity New • Data at 1.96 TeV on the charged particle multiplicity (pT > 0.4 GeV/c, |h| < 1) for “min-bias” collisions at CDF Run 2. Tune A! No MPI! • The data are compared with PYTHIA Tune A and Tune A without multiple parton interactions (pyAnoMPI). Rick Field – Florida/CDF/CMS
Min-Bias Correlations New • Data at 1.96 TeV on the average pT of charged particles versus the number of charged particles (pT > 0.4 GeV/c, |h| < 1) for “min-bias” collisions at CDF Run 2. The data are corrected to the particle level and are compared with PYTHIA Tune A at the particle level (i.e. generator level). Rick Field – Florida/CDF/CMS
Min-Bias: Average PT versus Nchg • Beam-beam remnants (i.e. soft hard core) produces low multiplicity and small <pT> with <pT> independent of the multiplicity. • Hard scattering (with no MPI) produces large multiplicity and large <pT>. • Hard scattering (with MPI) produces large multiplicity and medium <pT>. This observable is sensitive to the MPI tuning! = + + The CDF “min-bias” trigger picks up most of the “hard core” component! Rick Field – Florida/CDF/CMS
Charged Particle Multiplicity New • Data at 1.96 TeV on the charged particle multiplicity (pT > 0.4 GeV/c, |h| < 1) for “min-bias” collisions at CDF Run 2. Tune A prediction at 900 GeV! No MPI! Tune A! • The data are compared with PYTHIA Tune A and Tune A without multiple parton interactions (pyAnoMPI). • Prediction from PYTHIA Tune A for proton-proton collisions at 900 GeV. Rick Field – Florida/CDF/CMS
LHC Predictions: 900 GeV sHC! • Charged multiplicity distributions for proton-proton collisions at 900 GeV (pT > 0.5 GeV/c, |h| < 2) from PYTHIA Tune A, Tune DW, Tune DWT, Tune S320, and Tune P329. Rick Field – Florida/CDF/CMS
LHC Predictions: 900 GeV 1,000 events L = 24/mb! 100 events L = 2.4/mb! 10 events L = 0.24/mb! sHC! • Charged multiplicity distributions for proton-proton collisions at 900 GeV (pT > 0.5 GeV/c, |h| < 2) from PYTHIA Tune A, Tune DW, Tune DWT, Tune S320, and Tune P329. Rick Field – Florida/CDF/CMS
“Hard Scattering” Component QCD Monte-Carlo Models:Lepton-Pair Production • Start with the perturbative Drell-Yan muon pair production and add initial-state gluon radiation (in the leading log approximation or modified leading log approximation). “Underlying Event” • The “underlying event” consists of the “beam-beam remnants” and from particles arising from soft or semi-soft multiple parton interactions (MPI). • Of course the outgoing colored partons fragment into hadron “jet” and inevitably “underlying event” observables receive contributions from initial-state radiation. Rick Field – Florida/CDF/CMS
Average PT versus Nchg • Data at 1.96 TeV on the average pT of charged particles versus the number of charged particles (pT > 0.4 GeV/c, |h| < 1) for “min-bias” collisions at CDF Run 2. The data are corrected to the particle leveland are compared with PYTHIA Tune A, Tune DW, and the ATLAS tune at the particle level (i.e. generator level). • Particle level predictions for the average pT of charged particles versus the number of charged particles (pT > 0.5 GeV/c, |h| < 1, excluding the lepton-pair) for for Drell-Yan production (70 < M(pair) < 110 GeV) at CDF Run 2. Rick Field – Florida/CDF/CMS
Average PT versus Nchg No MPI! • Z-boson production (with low pT(Z) and no MPI) produces low multiplicity and small <pT>. • High pT Z-boson production produces large multiplicity and high <pT>. • Z-boson production (with MPI) produces large multiplicity and medium <pT>. = + + Rick Field – Florida/CDF/CMS
Average PT(Z) versus Nchg No MPI! • Predictions for the average PT(Z-Boson) versus the number of charged particles (pT > 0.5 GeV/c, |h| < 1, excluding the lepton-pair) for for Drell-Yan production (70 < M(pair) < 110 GeV) at CDF Run 2. • Data on the average pT of charged particles versus the number of charged particles (pT > 0.5 GeV/c, |h| < 1, excluding the lepton-pair) for for Drell-Yan production (70 < M(pair) < 110 GeV) at CDF Run 2. The data are corrected to the particle level and are compared with various Monte-Carlo tunes at the particle level (i.e. generator level). Rick Field – Florida/CDF/CMS
Average PT versus Nchg PT(Z) < 10 GeV/c No MPI! Remarkably similar behavior! Perhaps indicating that MPI playing an important role in both processes. • Predictions for the average pT of charged particles versus the number of charged particles (pT > 0.5 GeV/c, |h| < 1, excluding the lepton-pair) for for Drell-Yan production (70 < M(pair) < 110 GeV, PT(pair) < 10 GeV/c) at CDF Run 2. • Data the average pT of charged particles versus the number of charged particles (pT > 0.5 GeV/c, |h| < 1, excluding the lepton-pair) for for Drell-Yan production (70 < M(pair) < 110 GeV, PT(pair) < 10 GeV/c) at CDF Run 2. The data are corrected to the particle level and are compared with various Monte-Carlo tunes at the particle level (i.e. generator level). Rick Field – Florida/CDF/CMS
Tuning PYTHIA:Multiple Parton Interaction Parameters Hard Core Determines the energy dependence of the MPI! Determine by comparing with 630 GeV data! Affects the amount of initial-state radiation! Take E0 = 1.8 TeV Reference point at 1.8 TeV Rick Field – Florida/CDF/CMS
“Transverse” Conesvs “Transverse” Regions • Sum the PT of charged particles in two cones of radius 0.7 at the same h as the leading jet but with |DF| = 90o. • Plot the cone with the maximum and minimum PTsum versus the ET of the leading (calorimeter) jet. “Cone Analysis” (Tano, Kovacs, Huston, Bhatti) Transverse Cone: p(0.7)2=0.49p Transverse Region: 2p/3=0.67p Rick Field – Florida/CDF/CMS
Energy Dependenceof the “Underlying Event” “Cone Analysis” (Tano, Kovacs, Huston, Bhatti) • Sum the PT of charged particles (pT > 0.4 GeV/c) in two cones of radius 0.7 at the same h as the leading jet but with |DF| = 90o. Plot the cone with the maximum and minimum PTsum versus the ET of the leading (calorimeter) jet. • Note that PYTHIA 6.115 is tuned at 630 GeV with PT0 = 1.4 GeV and at 1,800 GeV with PT0 = 2.0 GeV. This implies that e = PARP(90) should be around 0.30 instead of the 0.16 (default). • For the MIN cone 0.25 GeV/c in radius R = 0.7 implies a PTsum density of dPTsum/dhdf = 0.16 GeV/c and 1.4 GeV/c in the MAX cone implies dPTsum/dhdf = 0.91 GeV/c (average PTsum density of 0.54 GeV/c per unit h-f). 630 GeV 1,800 GeV PYTHIA 6.115 PT0 = 1.4 GeV PYTHIA 6.115 PT0 = 2.0 GeV Rick Field – Florida/CDF/CMS
“Transverse” Charged DensitiesEnergy Dependence Increasing e produces less energy dependence for the UE resulting in less UE activity at the LHC! Lowering PT0 at 630 GeV (i.e. increasing e) increases UE activity resulting in less energy dependence. • Shows the “transverse” charged PTsum density (|h|<1, PT>0.4 GeV) versus PT(charged jet#1) at 630 GeV predicted by HERWIG 6.4 (PT(hard) > 3 GeV/c, CTEQ5L) and a tuned version of PYTHIA 6.206 (PT(hard) > 0, CTEQ5L, Set A, e = 0, e = 0.16 (default) and e = 0.25 (preferred)). • Also shown are the PTsum densities (0.16 GeV/c and 0.54 GeV/c) determined from the Tano, Kovacs, Huston, and Bhatti “transverse” cone analysis at 630 GeV. Rick Field Fermilab MC Workshop October 4, 2002! Reference point E0 = 1.8 TeV Rick Field – Florida/CDF/CMS
CDF Run 1 PT(Z) Tune used by the CDF-EWK group! PYTHIA 6.2 CTEQ5L • Shows the Run 1 Z-boson pT distribution (<pT(Z)> ≈ 11.5 GeV/c) compared with PYTHIA Tune A (<pT(Z)> = 9.7 GeV/c), and PYTHIA Tune AW (<pT(Z)> = 11.7 GeV/c). UE Parameters ISR Parameters Effective Q cut-off, below which space-like showers are not evolved. Intrensic KT The Q2 = kT2 in as for space-like showers is scaled by PARP(64)! Rick Field – Florida/CDF/CMS
Df Jet#1-Jet#2 Jet#1-Jet#2 Df Distribution Jet-Jet Correlations (DØ) • MidPoint Cone Algorithm (R = 0.7, fmerge = 0.5) • L= 150 pb-1 (Phys. Rev. Lett. 94 221801 (2005)) • Data/NLO agreement good. Data/HERWIG agreement good. • Data/PYTHIA agreement good provided PARP(67) = 1.0→4.0 (i.e. like Tune A, best fit 2.5). Rick Field – Florida/CDF/CMS
CDF Run 1 PT(Z) PYTHIA 6.2 CTEQ5L • Shows the Run 1 Z-boson pT distribution (<pT(Z)> ≈ 11.5 GeV/c) compared with PYTHIA Tune DW, and HERWIG. UE Parameters ISR Parameters Tune DW uses D0’s perfered value of PARP(67)! Intrensic KT Tune DW has a lower value of PARP(67) and slightly more MPI! Rick Field – Florida/CDF/CMS
PYTHIA 6.2 Tunes All use LO as with L = 192 MeV! UE Parameters Uses CTEQ6L Tune A energy dependence! (not the default) ISR Parameter Intrinsic KT Rick Field – Florida/CDF/CMS
PYTHIA 6.2 Tunes These are “old” PYTHIA 6.2 tunes! There are new 6.420 tunes by Peter Skands (Tune S320, update of S0) Peter Skands (Tune N324, N0CR) Hendrik Hoeth (Tune P329, “Professor”) All use LO as with L = 192 MeV! UE Parameters Tune B Tune AW Tune A ATLAS energy dependence! (PYTHIA default) Tune BW ISR Parameter Tune DW Tune D6 Tune D Tune D6T Intrinsic KT Rick Field – Florida/CDF/CMS
Peter’s Pythia Tunes WEBsite • http://home.fnal.gov/~skands/leshouches-plots/ Rick Field – Florida/CDF/CMS
Min-Bias “Associated”Charged Particle Density 35% more at RHIC means 26% less at the LHC! • Shows the “associated” charged particle density in the “transverse” regions as a function of PTmax for charged particles (pT > 0.5 GeV/c, |h| < 1, not including PTmax) for “min-bias” events at 0.2 TeV and 14 TeVfrom PYTHIA Tune DW and Tune DWT at the particle level (i.e. generator level). The STAR data from RHIC favors Tune DW! ~1.35 ~1.35 0.2 TeV → 14 TeV (~factor of 70 increase) RHIC LHC Rick Field – Florida/CDF/CMS
Min-Bias “Associated”Charged Particle Density • Shows the “associated” charged particle density in the “transverse” region as a function of PTmax for charged particles (pT > 0.5 GeV/c, |h| < 1, not including PTmax) for “min-bias” events at 0.2 TeV, 1.96 TeV and 14 TeVpredicted by PYTHIA Tune DW at the particle level (i.e. generator level). ~1.9 ~2.7 0.2 TeV → 1.96 TeV (UE increase ~2.7 times) 1.96 TeV → 14 TeV (UE increase ~1.9 times) RHIC LHC Tevatron Rick Field – Florida/CDF/CMS
The “Underlying Event” at STAR • At STAR they have measured the “underlying event at W = 200 GeV (|h| < 1, pT > 0.2 GeV) and compared their uncorrected data with PYTHIA Tune A + STAR-SIM. Rick Field – Florida/CDF/CMS
Preliminary The “Underlying Event” at STAR Charged PTsum Density “Back-to-Back” Charged Particles (|h|<1.0, PT>0.2 GeV/c) Data uncorrected PYTHIA Tune A + STAR-SIM “Toward” 0.55 “Away” ~1.5 “Transverse” 0.37 “Leading Jet” PT(jet#1) (GeV/c) “Back-to-Back” • Data on the charged particle scalar pT sum density, dPT/dhdf, as a function of the leading jet pT for the “toward”, “away”, and “transverse” regions compared with PYTHIA Tune A. Rick Field – Florida/CDF/CMS
Min-Bias “Associated”Charged Particle Density If the LHC data are not in the range shown here then we learn new (QCD) physics! RDF LHC Prediction! • Shows the “associated” charged particle density in the “transverse” region as a function of PTmax for charged particles (pT > 0.5 GeV/c, |h| < 1, not including PTmax) for “min-bias” events at 1.96 TeVfrom PYTHIATune A, Tune S320, Tune N324, and Tune P329 at the particle level (i.e. generator level). Tevatron LHC • Extrapolations of PYTHIA Tune A, Tune DW, Tune DWT, Tune S320, Tune P329, and pyATLAS to the LHC. Rick Field – Florida/CDF/CMS
“Transverse” Charged Density • Shows the charged particle density in the “transverse” region for charged particles (pT > 0.5 GeV/c, |h| < 1) at 7 TeVas defined by PTmax, PT(chgjet#1), and PT(muon-pair) from PYTHIATune DWat the particle level (i.e. generator level). Charged particle jets are constructed using the Anti-KT algorithm with d = 0.5. Rick Field – Florida/CDF/CMS
Min-Bias “Associated”Charged Particle Density • Shows the “associated” charged particle density in the “transverse” region as a function of PTmax for charged particles (pT > 0.5 GeV/c, |h| < 1, not including PTmax) for “min-bias” events at 0.2 TeV, 0.9 TeV, 1.96 TeV, 7 TeV, 10 TeV, 14 TeVpredicted by PYTHIA Tune DW at the particle level (i.e. generator level). LHC14 LHC10 LHC7 Tevatron 900 GeV RHIC 0.2 TeV → 1.96 TeV (UE increase ~2.7 times) 1.96 TeV → 14 TeV (UE increase ~1.9 times) RHIC LHC Tevatron Linear scale! Rick Field – Florida/CDF/CMS
Min-Bias “Associated”Charged Particle Density • Shows the “associated” charged particle density in the “transverse” region as a function of PTmax for charged particles (pT > 0.5 GeV/c, |h| < 1, not including PTmax) for “min-bias” events at 0.2 TeV, 0.9 TeV, 1.96 TeV, 7 TeV, 10 TeV, 14 TeVpredicted by PYTHIA Tune DW at the particle level (i.e. generator level). LHC14 LHC10 LHC7 Tevatron 900 GeV RHIC 7 TeV → 14 TeV (UE increase ~20%) LHC7 LHC14 Linear on a log plot! Log scale! Rick Field – Florida/CDF/CMS
sHC: PTmax > 5 GeV/c • The inelastic non-diffractive PTmax > 5 GeV/c cross section versus center-of-mass energy from PYTHIA (×1.2). Still lots of events! Log scale! Linear scale! stot = sEL + sSD+sDD+sHC • sHC(PTmax > 5 GeV/c) varies more rapidly. Factor of 2.3 increase between 7 TeV (≈ 0.56 mb) and 14 teV (≈ 1.3 mb). Linear on a linear scale! Rick Field – Florida/CDF/CMS