Download
1 / 16
160 likes | 524 Views
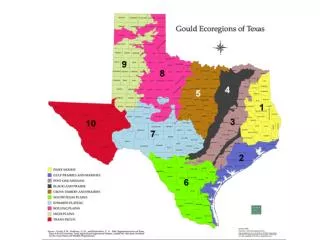
SAND THICKNESS MAP OF PART OF CARRIZO_WILCOX AQUIFER IN EAST_CENTRAL TEXAS. THET NAING MASTER CANDIDATE PHYSICAL HYDROGEOLOGY DEPT.GEOL. SCIENCES. OUTLINE. -INTRODUCTION -MY GOAL -LOCATION -PROCEDURE -SUMMARY/PROBLEMS. INTRODUCTION.

E N D
SAND THICKNESS MAP OF PART OF CARRIZO_WILCOX AQUIFER IN EAST_CENTRAL TEXAS THET NAING MASTER CANDIDATE PHYSICAL HYDROGEOLOGY DEPT.GEOL. SCIENCES
OUTLINE -INTRODUCTION -MY GOAL -LOCATION -PROCEDURE -SUMMARY/PROBLEMS
INTRODUCTION -Numerical GW flow modeling is a tool to model movement of groundwater in time and space -Required parameters mostly related to spatial distribution of sediment properties -Most sensitive parameter is hydraulic conductivity, also hard to measure and can be expensive. -Alternative to actual measurement of hydraulic conductivity is to estimate from grain size and sedimentary facies distribution.
MY GOAL -To get spatial distribution of -Elevation of individual beds -Thickness of beds -Sand percent in a particular bed from publicly available data using Arc View.
PROCEDURE -Data Acquisition -County Base Maps from Exercise 3 -Surface elevation from TWDB well data http://www.twdb.state.tx.us/data/waterwells/well_info.html -Figures from a TWDB Reports Hand drawn contour maps beds of of Carrizo and Wilcox group -Digitize figures (the most tedious task) -elevation of Carrizo and Wilcox group layers -percent sand maps
PROCEDURE (CONT) • Export digitized data in ASCII format and Arc View shape file format • In both formats, surface elevation information is represented only as • ASCII format which gives elevation at contour lines • Arc View shape file which also gives elevation at contour lines
PROCEDURE (CONT) • To represent as surface features/Spatial data in Arc View, • Create TIN using 3D analyst extension
PROCEDURE (CONT) • -Convert ASCII format (XYZ) to DBF file, open table in Arc View, Add Event Theme in View and interpolate Grid** (I believe there is a shorter version in Arc View to perform this process) • ** It takes a long time to grid data for my study area of roughly 180km by 180 km with 1000m spacing
PROCEDURE (CONT) Preparation to supply Arc View with gridded data -Surfer is used -ASCII data is gridded in Surfer 7 -Grid is saved out as XYZ ASCII format -Change to *.DBF format -Because all digitized figures were gridded with same parameters, all data sets can be appended to each other or in a single DBF file easily -Processed DBF file is imported into Arc View
PROCEDURE (CONT) Example
PROCEDURE (CONT) -Contour lines are regenerated in Arc View using ‘create contour’ -Contour lines outside the study area are cut out by using ‘Geopreocessing’- ‘clip one theme based on another’
PROCEDURE (CONT) Result comparison between contour without gridding and contour with gridding
SUMMARY -It is better to use Grids to extract data or perform simple math function -Spatially distributed bed thickness is the result of grid interpolation of hand drawn maps of bed contours. Even though interpolation generally cause the results to deviate from original values, I started out with contour maps that it is already biased. To get around that error would be to use well logs which the bed elevation contours are generally based on. -The result is the same whichever way is used to generate grids but my preference is to start with ASCII data and preprocess in either EXCEL or SURFER. It reduces processing time in Arc View.
MY PROBLEMS -Initially planned to use USGS 250k DEM for my surface elevation reference but I did not find a way to get around the coordinate systems of DEM in Arc View. I did not give enough time to find solution in Arc Info. -Digitizing is seemingly easy but it is time consuming. I still need to digitize sand percent thickness maps.