Download
1 / 29
290 likes | 469 Views
Association of State Correctional Administrators All Directors Training Conference. Economics and Cost Containment. Roberts T. Jones Founder of Education & Workforce Policy. Budget Cuts and New Investment Impact on Corrections. Political & Economic Impact of Recession

E N D
Association of State Correctional Administrators All Directors Training Conference Economics and Cost Containment Roberts T. Jones Founder of Education & Workforce Policy
Budget Cuts and New InvestmentImpact on Corrections Political & Economic Impact of Recession • Short Term State Policies • Longer Term Impact Versus State Demand for Economic Growth Impact of Change in Political Leadership Direct Impact on Corrections
ECONOMIC OUTLOOKWave #1 Short Term Impact • Recession of 2009 • 8.5 million lost Jobs • $70.5 billion in lost State Revenues • Revenue/Jobs Slowly Recovering • State Tax Revenues up 10.8% in 2nd Quarter of 2011 • Still lower than 4 years ago • Jobs-over 100,000 per month • States have closed budget shortfalls of over $430 billion for fiscal years 2009, 2010, and 2011 combined. • $103 billion FY2012 • $46 billion FY2013 • States Balancing Budgets Dependent on… • Cuts in Education, Health Care, Corrections, Staff, Infrastructure, etc. • Availability of Federal Stimulus Dollars • Trust Fund Loans for Extensions to Unemployment Insurance
Short Term Impact (Cont) • States assume that job growth and revenue growth will restore budget cuts to essential services. 2011 & 2012 Revenue Increased.. • State tax collections, are still 9 percent below pre-recession levels • $21 billion below 2008 levels. • States will continue to face large gaps in fiscal years 2013, 2014, and beyond. • There is a projected $103 billion gap in 2012 • Meanwhile the need for state-funded services has not declined.
Short Term Budget Reductions States Proposals 201120122013 Benefit Re 13 17 12 Ac/Bd Cuts 20 17 6 Targeted Cuts 34 38 20 Layoffs 20 15 7 Furloughs 19 9 3 Salary Red 9 11 7
Short Term Budget ReductionsState Proposals 20112012 • Higher Education 18 25 • K-12 Education 18 16 • Corrections 17 14
ECONOMIC OUTLOOKWave #2 Mid Term Impact • Slow Employment Growth • Lower Earnings • Lower Tax Revenue Projected • State & Local Gov cut 455,000 jobs since 2010 • States Propose Tax Increases • Individuals and Businesses Impacted by Recession • Less Able to Shoulder Burden of Increased Tax Loads • Federal Stimulus • Recovery Act $37.9 billion Exhausted 2012 • Used to Cover State Budget Shortfall
Mid Term Impact (Cont) • Health Care Costs Rising • NHE expected to average 6.9% increase per year and rise to 19.3% of GDP by 2019 • Medicare Trust Fund by 2012 • Will Lay Out 3 times What It Takes In • State Medicaid Cost Increasing/Fed Cont Decrease StateFederal • 2010 -4.5% 14.3% • 2011 17.5% 8.6% • 2012 18.6% -13.0% • Medicaid Fastest Growing Portion of State Budget
Mid Term Impact (Cont) • States Pension Plan Underfunded • 12% of WkForce State and Local Employees • Pensions Underfunded by $1 Trillion • Post Ret Health Liability $700 Billion • Pension plans' assets fell 26% in 2009, primarily because of investment losses • 45% of State Workers projected to retire in next 5 years and States will have to ‘find the revenue’ • Unemployment Trust Funds Exhausted • Borrow From Feds • Further UI Extensions • Loan Pay Back, Increase Payroll Tax, General Revenue • State/Local Debt (Not Including Pension Underfunding) • 2000 $1.2 Trillion • 2010 $2.8 Trillion
Pension Source: Pew Center on the States
State Unemployment Fund Status Washington Vermont Minnesota Montana NorthDakota Maine New York Michigan (upper pennisula) Wisconsin Oregon NewHampshire Michigan SouthDakota Idaho Pennsylvania Massachussetes Wyoming Rhode Island Delaware Iowa Connecticut Maryland Ohio Nebraska NewJersey Illinois Nevada Utah Colorado Indiana Kentucky Kansas West Virginia Missouri North Carolina Virginia California Tennessee South Carolina Oklahoma Arkansas Arizona NewMexico Alabama Georgia Mississippi Louisiana Florida Texas Alaska Hawaii
Impact to Date… • 33 States Report 2012 Deficit of $75.1 Billion 17 States to Go • 21 States Report 2013 Deficit of $61.8 Billion 29 States To Go • 23 States Had to Make Further Mid Year Cuts in 2011 • 17 Made Additional Cuts to Corrections • 6 States in ‘Sever Fiscal’ Crisis • These states equal 48% of total budget shortfalls for FY2012 • Cites/Counties Declaring Bankruptcy • Harrisburg, PA • Central Falls, RI • City Vallejo, CA • Jefferson County, AL • School Districts Pending
STATE ECONOMIC CHALLENGESWave #3 Long Term Impact • States Focused on Economic Growth and Jobs • Slow Growth Population and Workforce • Rising Percentage of Older Population • Fewer Younger Entrants to Workforce • Smaller Percentage of Population of Workforce Age • Increasing Diversity of Pop and Workforce • Increasing % of Workforce Educationally Unprepared for New Jobs • New Jobs Require Increased Skills and Education
Future US Labor Markets • Demographics • Slow Population Growth • 0.9% per yr. • 0.7% by 2030 • Slow Labor Force Growth • .08% yr • Increased Percentage of Older Population • Fewer Younger People Entering Workforce • Core Workforce Age Group is Declining US Economic Growth Will Depend on Fewer Workers….And Increased Productivity!! BLS
Workforce in America is Shrinking and Growing Older 200020202040 Age 0-19 28.5% 26.4% 25.9% 20-64 59.0% 57.2% 53.6% 65+ 12.4% 16.3% 20.4% BLS/DOC
Projected Job GrowthHigh Skills • 1.3% Growth Per Yr Exceeds Labor Force Growth of 0.5% • 85% of New Jobs Require Post Secondary Ed • 80% of Fastest Growing Req Post Sec • 78% of All Jobs Require PS Ed by 2014 • 60% of Fastest Declining Occupations..Low Skill • 70% of Fastest Declining are Lower Earnings Quartile • 12% Unskilled & Dropping to 2% • 1998 65% • 2008 10% • 67.2% of New Job Growth by 2016 Require PS Ed DOL:BLS
US Workforce Not Prepared… • By 2014… 78% Of ALL Jobs Require Some Post Sec Education • But Population… • 12.9% No HS/GED • 31.2% HS Degree/GED • 16.8% Some College..No Degree • 9.1% AA Deg • 29.9% BA Deg or Higher • 32 States Project Shortage of Degreed Workforce (International Students) • Now 2 Million/Year….Needs to Be 3 Million/Year to Meet Standard • 16 Million National Shortage of AA/BA Degs By 2025 SHEEO 08/Census 10
SHIFT IN STATE FOCUS…Wave #3 New Budget Priorities To Produce the Competitive Workforce, States Will Have to: • Increase the Academic Performance of ‘All’ Students. • Provide Post Sec Ed to Those Groups Who Have Been Least Preparedand Least Likely to Enroll or Graduate. • Significantly Increase the Acad/Skill Level of Current Workforce • States Forced to Increase Budgets for : • Education, Workforce Training, Pensions, Health,
AGAINST THIS BACK DROP..‘New Political Leadership’ • Change in elected officials has been substantial In the last two years • Over 50% new Governors • Over 22% new state legislators • 30% of State Legislatures Changed Majority Party • 110 new members of the US House of Representatives and Senate. • Economic, Political, and Social Expectations Have created Growing Demand for Fundamental Change in: • Spending Priorities and Controlling Growth in Gov, Budgets, and Spending
IMPACT ON CORRECTIONS • As States Shift Budget Priorities… • Corrections Increasingly Identified as a ‘Controllable’ • Growth in Incarceration (13 Times Growth in Pop) • Growth in General Fund Expenditures (109% 1987-2009) • Higher Ed Costs 22% Over Same Period • Growth in Less Educated Pop (LHS Grew 30%) • Growth in Older Inmates • Growth in Medical Costs • High Rate of Recidivism (68% Arrested/43% Incarcerated) • Growth in Staff Salaries/Pensions/Benefits
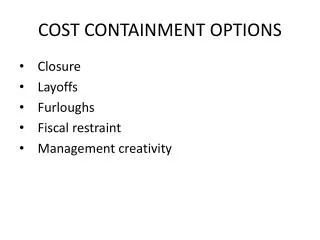
Demand for Corrections CostReduction! • Review of staffing and use of overtime • Medical cost reduction strategies • Food Service caloric and meal (i.e. brunch) reductions and review of strategic purchasing agreements • Use of technology to reduce utility costs • Staff training practices (use of technology and shared training programs, etc.) • Greater use of green practices (e.g. recycling)
Demand for New Model in Corrections As states grapple with their Budget Crisis, officials are publically discussing and acting on ideas that would not have surfaced in the past, such as: • Sentencing reform • Early Release Programs • Electronic monitoring, enabling offenders to live at home • Severely overcrowding existing facilities • Placing inmates in out-of-state facilities • Focus on Recidivism • Focus on Reentry Programs • Piloting secure offender transition facilities focused on short term low security offenders and/or parole violators in need of intensive programming and reentry services • Contracting for the financing, design, construction, and operation of prison beds
2011 States Enacted Legislation • Budget/Oversight- 26 states (AR, CA, CO, NY, NV) • Sentencing- 20 states (CA, FL, LA, NV, TX) • Treatment Programs- 19 states (AR, FL, NV, VA) • Sentencing Alternatives- 18 states (AR, CO, FL, TX) • Reduction of Recidivism- AZ, MI, OH, PA, TX, WI • Justice Reinvestment • Profiling Inmates • Targeted Program Investments
Role of Government ChangingAccountable for ROI • Stronger Government Oversight • Performance Expectations Facilities Programming Operations Re-Entry Security Recidivism • Performance Measures Costs Quality Outcomes • Consequences Contracting for Performance Fed, State, Local, Non-profit, or Private
As Correction Professionals... • Policy Makers and Legislators Need Professional Input! • No Time for Short Term Political Proposals • Correction Professionals Need to Step Forward • You Have Experience With Inmate Classification • Which Inmates Can Benefit • Which Can Be Released without Risk of Public Safety • You Know Which Program interventions Pay Off • Which Group of Inmates Respond to Which Interventions • You Know Where There is Waste and Costs Can be Reduced Without Adverse Security Impact
CORRECTIONS WILL CHANGE! • Change In Corrections Is Certain • Correction Professionals Need to Be Engaged • Understanding the Environment • Supportive of New Directions • Leadership in Developing A Stronger Government Role • In Financial Management • In New Public Policy Proposals • In Stronger Accountability for Positive ROI Who better to lead the way than you?
Thank You.... Roberts T Jones Education and Workforce Policy bob.jones@mtctrains.com