Download
1 / 11
120 likes | 360 Views
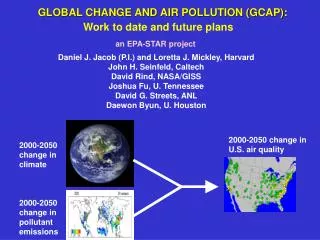
Johannes Bollen Dutch Environmental Assessment Agency (MNP) TFIAM. Local Air Pollution and Global Climate Change A Cost-Benefit Analysis by Bollen, J., Brink, C., Eerens, H., and van der Zwaan, B. Dutch share of expenditures on LAP and GCC may shift dramatically. Maximum. Current .

E N D
Johannes Bollen Dutch Environmental Assessment Agency (MNP) TFIAM Local Air Pollution and Global Climate ChangeA Cost-Benefit Analysisby Bollen, J., Brink, C., Eerens, H., and van der Zwaan, B.
Dutch share of expenditures on LAP and GCC may shift dramatically Maximum Current Feasible Legislation Reductions 2000 2020 2020 Total (bn €'s) 1.9 6.7 12.8 LAP 75% 60% 45% GCC 25% 40% 55% calculations based on: 1]RAINS/Milieubalans(MNP,2005) 2] 2% growth yr-1 of GDP LAP = Local Air Pollution GCC = Global Climate Change
Results CBA on LAP & GCC • Discounted LAP benefits significantly exceed those of GCC • LAP policies alone lead to modest CO2 emission reductions, but magnify when combined with GCC policies • LAP expenditures in EU decline from GCC policy expenditures LAP = Local Air Pollution GCC = Global Climate Change CBA = Cost Benefit Analysis
MERGE model (Manne&Richels) + LAP • Top-down economy + bottom-up energy • Intertemporal maximization of discounted utility • Abatement "where", "when“, and "what" flexibility • 9 regions, Pareto-efficient solutions for 2010-2150 • Market and much larger non-market damages (human health, biodiversity) + LAP: Restrict to primary energy related particulate matter + precautionary assumption • 6% attributive risk of premature deaths from long-term exposure • Value of Statistical Life at Median values (1 million euro) LAP = Local Air Pollution GCC = Global Climate Change CBA = Cost Benefit Analysis
Baseline: Premature Deaths to PM2.5 = 108 million over 2000-2150 period Temperature in 2150 = 4.8 0Celsius compared pre-industrial level 2.0 93 million PM death 3.3 0Celsius 1.5 1.0 % change of discounted consumption 0.5 0.0 -0.5 GCC LAP GCC+LAP GCC LAP Costs Discounted LAP benefits significantly larger than GCC benefits (ratio >> 1!!!!) 8 million PM death 8 million PM death 4.7 0Celsius 3.0 0Celsius LAP = Local Air Pollution GCC = Global Climate Change CBA = Cost Benefit Analysis
Yes, ratio between LAP and GCC benefits fallls in the range of 2-31 Benefits GCC Benefits LAP Costs Global Temperature Change (Celsius) 4 3.0 3.0 3.0 3.1 3.0 3.1 2.3 4.1 3.0 3.0 2.4 3.1 2.8 3.3 Consumption ratio ratio ratio benefits 2 5 4 7 6 4 2 21 31 2 3 14 12 Premature Deaths in 2000-2150 (millions) % of Discounted 0 8 9 8 12 8 8 10 7 8 7 8 8 -1 base Presriptive discounting lower climate sensitivity higher climate sensitivity lower Value of Statistical Life higher Value of Statistical Life lower elasticity emission-concentration higher urbanization in developing countries higher PM emissions in developing countries lower Climate Change damage valuation higher Climate Change damage valuation Value of staistical life in purchasing power parity Are we certain??? LAP = Local Air Pollution GCC = Global Climate Change CBA = Cost Benefit Analysis
Co-benefits from LAP to GCC magnify when implementing climate policies (synergy!!!) CO2 emissions in 2050 1.5 2.4 gas Western Europe oil China 1.0 1.6 coal Pg C 0.5 0.8 0.0 0.0 2000 base GCC LAP GCC+LAP 2000 base GCC LAP GCC+LAP LAP = Local Air Pollution GCC = Global Climate Change CBA = Cost Benefit Analysis
LAP expenditures in EU decline from GCC policies 1.2 2.7 0.8 2.2 Western Europe LAP Expenditures CO2 in Gt C (bn 2000 US$) 0.4 1.7 0.0 1.2 2000 2010 2020 2030 2040 2050 CO2 Emissions: LAP GCC+LAP End-of-pipe abatement costs: LAP (right) GCC+LAP (right) LAP = Local Air Pollution GCC = Global Climate Change CBA = Cost Benefit Analysis
Results CBA on LAP & GCC • Discounted LAP benefits = 2-31 * GCC benefits • LAP policies alone lead to modest CO2 emission reductions, but magnify when combined with GCC policies • LAP expenditures in EU decline from GCC policies • Caveat: this analysis restricts to primary PM LAP = Local Air Pollution GCC = Global Climate Change CBA = Cost Benefit Analysis
Preliminary Policy conclusions • No delay with GCC policies, but • integrate them into LAP strategies (it is the robust option) • Increase research to reduce uncertainty of GCC LAP = Local Air Pollution GCC = Global Climate Change CBA = Cost Benefit Analysis
Further and related work • This work: • Paper will be finalized by mid-June • Further work: • extend LAP to include • 1] Secondary aerosols (and increase the PM concentrations) • 2] SO2, NOx, and NH3 emissions and abatement cost curves • Related work: • on MNP web-site entitled “Sustainable energy: trade-offs and synergies between energy security, competitiveness, and environment” LAP = Local Air Pollution GCC = Global Climate Change CBA = Cost Benefit Analysis