Download
1 / 9
90 likes | 182 Views
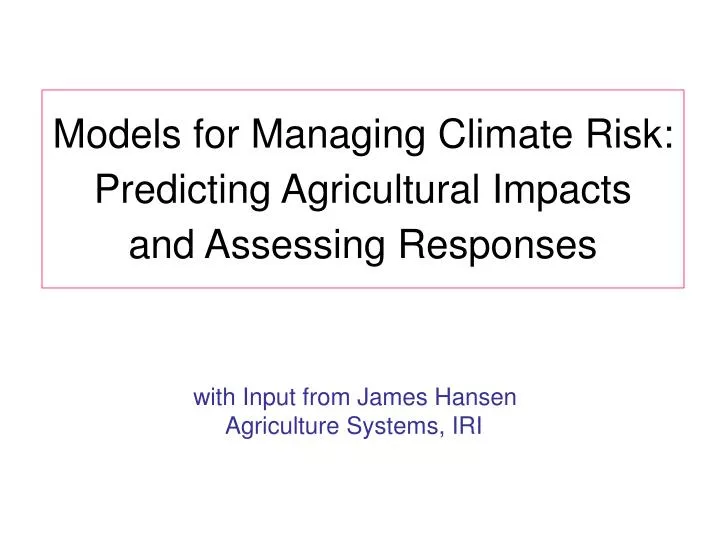
Models for Managing Climate Risk: Predicting Agricultural Impacts and Assessing Responses. with Input from James Hansen Agriculture Systems, IRI. FOREFITED OPPORTUNITY. HARDSHIP. CRISIS. Managing The Full Range of Variability. common assumption of a static policy.

E N D
Models for Managing Climate Risk: Predicting Agricultural Impactsand Assessing Responses with Input from James Hansen Agriculture Systems, IRI
FOREFITED OPPORTUNITY HARDSHIP CRISIS Managing The Full Range of Variability common assumption of a static policy
A Few Examples of Climate Risk Management for Agriculture Climate-based food and forage production forecasting Climate-informed management of trade & strategic reserves for food security, price stabilization Climate-informed food crises response Climate (forecast, monitoring, historic) information, education, advisory service to farmers Fostering resilience within farming systems (e.g., diversification) Supporting adaptive management Financial risk management services (e.g., index insurance) Strategic planning and investment under changing climatic baseline (e.g., breeding, land use planning)
Crop response to 3-month rainfall amount: nonlinear and non-monotonic. Eastern Equatorial Africa (Kenya) Crops respond not to mean conditions but to dynamic interactions: • Soil water balance • Phenology
y=3.33+1.34(1-exp(-0.133x)) R2 = 0.400 Nonlinear Regression: The Mitscherlitch function
Table 1. Prices and costs used for enterprise budgets. a PD (plants m-2) * price (KSH (kg seed)-1) * 10,000 (m2 ha-1) / 2500 (plants (kg seed)-1) b application rate (kg N ha-1) * price (KSH (kg CAN)-1) / 0.26 (kg N (kg CAN)-1) c application rate (kg N ha-1) * price (KSH (kg DAP)-1) / 0.17 (kg N (kg DAP)-1) d price (KSH day-1) * (60 days (weeding) +
Table 2. Rainfall prediction skills (Seasonal and monthly rainfall correlations between observed rainfall and Obs_SST & P_SST based rainfall forecasts)
Correlation between observed weather vs observed and persisted SST based crop yields estimated at Katumani and Makindu.
Assessing Responses, Benefits • Ex-ante impact evaluation • Confidence and credibility • Targeting • Value of information: Expected outcome of best response to new information minus expected outcome of best response to prior information: value utility climato-logy returns weather manage-ment forecasts environ-ment