Download
1 / 3
30 likes | 215 Views
Actual % Expected % Variation % Shrewsbury & Atcham 24.19 21.46 2.73 Nearest Neighbour: Chester 25.53 23.27 2.25 Nearest Neighbour: East Staffordshire 22.80 20.54 2.26 Bridgnorth 22.79 21.98 0.81 Nearest Neighbour: Babergh 23.00 20.07 2.93

E N D
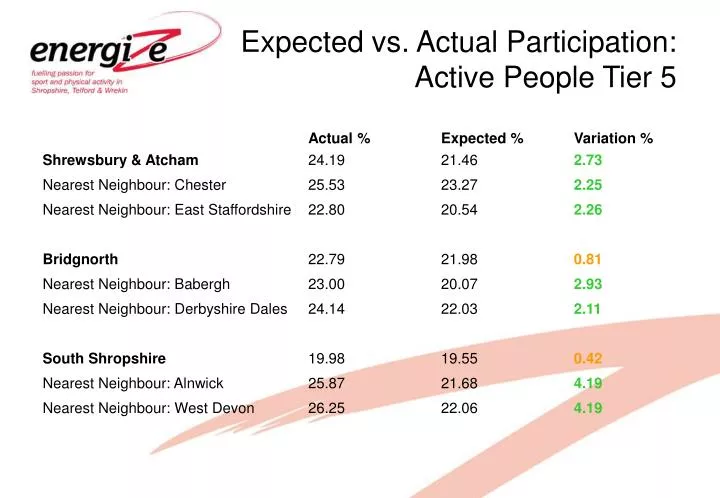
Actual %Expected % Variation % Shrewsbury & Atcham 24.19 21.46 2.73 Nearest Neighbour: Chester 25.53 23.27 2.25 Nearest Neighbour: East Staffordshire 22.80 20.54 2.26 Bridgnorth 22.79 21.98 0.81 Nearest Neighbour: Babergh 23.00 20.07 2.93 Nearest Neighbour: Derbyshire Dales 24.14 22.03 2.11 South Shropshire 19.98 19.55 0.42 Nearest Neighbour: Alnwick 25.87 21.68 4.19 Nearest Neighbour: West Devon 26.25 22.06 4.19 Expected vs. Actual Participation:Active People Tier 5
Actual %Expected % Variation % Oswestry 20.14 19.74 0.40 Nearest Neighbour: Alnwick 25.87 21.68 4.19 Nearest Neighbour: SABC 24.19 21.46 2.73 North Shropshire 21.07 20.72 0.35 Nearest Neighbour: Alnwick 25.87 21.68 4.19 Nearest Neighbour: West Devon 26.25 22.06 4.19 Telford & Wrekin 20.6020.26 0.34 Nearest Neighbour: Stockton on Tees 24.37 21.56 2.81 Nearest Neighbour: Cannock Chase 21.17 19.54 1.62 Expected vs. Actual Participation:Active People Tier 5
KEY Greenindicates a significantly higher variation (more than 2%) Orange indicates no variation (within 1%) Actual figures are based on the Active People results. Expected figures are based on a regression model determining the main economic and demographic factors that influence sport participation. It takes into account a wide range of economic and demographic variables outside the control of local authorities such as income, age, profession and family structure. Nearest Neighbour information is supplied by Institute of Public Finance (IPF) and is based on a number of indicators to create 'family groups' that have similar characteristics for example demographic, economic and social factors. The nearest neighbours with the highest variation % have been used for this purpose. Expected vs. Actual Participation:Active People Tier 5